Article Text

Abstract
Background/Aims To investigate the presence of short-wave fluorophores within regions of age-related macular degeneration (AMD)-associated macular atrophy (MA) area.
Methods This is a prospective, observational, cross-sectional case series. 25 eyes (18 patients) with late AMD and clinically identified MA were enrolled. Eyes were imaged using a confocal light-emitting diode blue-light fundus autofluorescence (FAF) device (EIDON, CenterVue, Padua, Italy) with 450 nm excitation wavelength and the capability for ‘colour’ FAF imaging, including both the individual red and green components of the emission spectrum. To produce images with a high contrast for isolating the green component, the red component was subtracted from the total FAF image. The main outcome measure was the presence of green emission fluorescence component (GEFC) within the MA area. Volume spectral domain optical coherence tomography (SD-OCT) scans were obtained through the macula and the OCT was correlated with the MA lesions identified on the FAF images, including regions of increased GEFC.
Results Of the investigated eyes, 11 out of 25 (44.0 %) showed the absence of GEFC in the MA area, whereas 14 eyes (56.0%) were characterised by GEFC within the MA area. The presence and distribution of GEFC in the MA area correlated with the presence of hyper-reflective material over Bruch’s membrane on the corresponding SD-OCT scans.
Conclusion Short-wave fluorophores, which contribute to the GEFC, are present in the MA area and appear to correspond to residual debris or drusenoid material. Short-wavelength fluorophores revealed by colour FAF imaging may warrant further study.
- imaging
- retina
- autofluorescence
Statistics from Altmetric.com
Introduction
Age-related macular degeneration (AMD) is the leading cause of irreversible central vision loss in developed countries.1 AMD can be complicated by the proliferation of choroidal neovascularization (CNV) (types 1 and 2) or intraretinal neovascularization (type 3), as well as the development of geographic atrophy (GA). The development of one of these complications characterises the late form of AMD, which has an estimated prevalence of 0.8% in the US population 40 years of age and older.2 3Macular atrophy (MA) has been suggested as a more preferred and general term to describe regions of retinal pigment epithelium (RPE) and photoreceptor loss in the macula whether it is associated with CNV or not (GA being limited to cases without associated CNV).4 The term MA may be especially preferred as it is now apparent by optical coherence tomography (OCT) angiography that CNV is frequently present in AMD eyes even in the absence of visible exudation.5 6
Areas of MA appear as regions of well-demarcated decreased autofluorescence (AF) on fundus autofluorescence (FAF) imaging. FAF allows for accurate measurement of the MA area, with high levels of reproducibility, allowing the enlargement of these lesions to be precisely monitored.7–10 Not surprisingly, FAF images have been recommended to be acquired at regular intervals in clinical studies investigating late AMD.11 The AF of the retina and RPE can be excited across a broad range of wavelengths. Depending on the wavelength used, the total amount of fluorescence and contributions to the total AF signal from different fluorophores may vary. In most studies, a confocal scanning laser ophthalmoscope with a 488 nm blue light has been used. Using this 488 nm wavelength, much of the detected AF is thought to originate from lipofuscin in the RPE. RPE atrophy and consequent loss of intrinsic lipofuscin produce an area with a low to extinguished AF signal with sharply demarcated borders.12
Recently, a new confocal blue-light FAF device (EIDON, CenterVue, Padua, Italy) using a 450 nm wavelength and light-emitting diode (LED) light source has been introduced. A different range of fluorophores are thought to be excited at 450 nm compared with 488 nm.13 Thus, 450 nm FAF imaging provides an opportunity to study these new fluorophores, which may provide additional contrast to reveal structures or abnormalities in MA lesions which may be relevant to disease pathogenesis. There are challenges, however, in isolating the signal from these minor fluorophores as the magnitude of the emission signal may be relatively weak. The new confocal LED blue-light FAF system offers an important potential advantage in that the full-emission spectrum is detected on a colour sensor, providing so-called ‘colour FAF’ imaging. As a result, the emission spectrum can be divided into long-wave and short-wave emission components (‘red’ (560–700 nm) and ‘green’ (510–560 nm) emission fluorescence components, REFC and GEFC, respectively). This offers a significant advantage for isolating minor fluorophores whose emission spectrum might otherwise be overwhelmed by the strong emission of lipofuscin in the longer wavelength end of the emission spectrum (the REFC). These minor fluorophores which are excited by the shorter blue light may emit in the shorter-wavelength end of the spectrum (GEFC) and thus can be distinguished from lipofuscin. Thus, colour FAF imaging has the potential to provide additional contrast to reveal different substructures in fundus lesions.
To evaluate this potential of colour FAF imaging, in this pilot study, we imaged a series of eyes with late atrophic AMD and correlated the REFC and GEFC features with OCT.
Methods
Study participants
This study is a prospective, observational, cross-sectional case series. Twenty-eight eyes from 20 patients with a clinical diagnosis of late AMD (dry or neovascular)2 and MA were enrolled from the medical retina clinics at the Doheny-UCLA Eye Centers. The study adhered to the tenets of the Declaration of Helsinki and Health Insurance Portability and Accountability Act. Written informed consent was obtained from all subjects prior to enrolment in the study.
All patients were enrolled between September 2016 and May 2017 and received a complete ophthalmologic examination, which included the measurement of best corrected visual acuity, intraocular pressure and dilated ophthalmoscopy. To be included, patients were required to have evidence of MA due to AMD as determined by the referring physician (SRS) and defined as well-demarcated areas of depigmentation with increased visibility of underlying choroidal vessels. Exclusion criteria were: (i) insufficient clear media to allow retinal imaging; (ii) history of any other macular or retinal disease aside from AMD; (iii) extension of the area of atrophy beyond the field of the image; (iv) inability to obtain images of sufficient quality in order to assess the atrophy and (v) the presence of haemorrhage, lipid or fluid (on OCT, colour imaging or examination) suggesting the presence of active neovascularization. Of note, eyes with prior treated quiescent neovascularization were not excluded as long as the features of MA were present.
FAF and spectral domain OCT imaging
All imaging was performed following pupillary dilation. FAF imaging was performed using a confocal LED fundus imaging system (EIDON, CenterVue) with a 450 nm illumination wavelength and emission detection between 500 and 750 nm. The device automatically aligns the patient such that the optics and light path are centred in the pupil. An autofocus procedure is performed to compensate for the eye’s spherical defect. A greyscale AF image with a frame size of 60(h)x55(w) degrees (resolution of 3680×3288 pixels) is acquired with a single exposure. The device also generates a ‘colour’ image (colour AF) based on the detected AF wavelength. This colour AF image consists of only the ‘red’ and ‘green’ channels, termed the REFC and GEFC, respectively.
Spectral domain (SD)-OCT imaging was performed using a Cirrus OCT (Carl Zeiss Meditec, Dublin, California, USA) with a macular cube 512×128 scan protocol covering a 6×6 mm area centred onto the fovea. To be included in the analysis, a signal strength of at least 6 was required (as recommended by the manufacturer manual).
Image processing
The image processing algorithm was designed to investigate the presence of GEFC within the MA area as illustrated in figure 1. Two graders (EB and SB) checked the quality of all images and as noted above, only eyes with AF images of sufficient quality to assess for the presence of atrophy and corresponding OCT volume scans with signal strength >6 were included in the image processing.

Representation of the algorithm used to process the images. In order to evaluate the presence of green emission fluorescence component (GEFC) within the macular atrophy area, the colour fundus autofluorescence (FAF) and grey FAF images were exported from the device. The colour FAF image underwent the ‘split channels’ function, which splits the image into the respective red and green image components (considering no blue component was present in the colour FAF image). Finally, in order to visualise those areas where the GEFC was still present, despite the red emission fluorescence component was absent or at least reduced, the ‘subtraction’ function was carried on between the grey FAF image and the ‘red channel’ of the colour FAF image (after a ‘Gaussian blur’ filter was applied on these images). Finally, the obtained image was ‘binarised’. AF, autofluorescence.
For each eye, both the colour AF and greyscale AF images were exported and then imported into image analysis ImageJ software V.1.50 (National Institutes of Health, Bethesda, Maryland; available at http://rsb.info.nih.gov/ij/index.html). The colour AF image was processed with the ‘ split channels’ function, which splits the image into the respective red and green image components (no blue component was present in the colour AF image). Finally, in order to optimise visualisation of those areas where the GEFC was still present, despite absent or reduced REFC, the ‘subtraction’ function was used to subtract the ‘red channel’ carried on between the AF image and the ‘red channel’ of the colour FAF image. By subtracting the REFC from the AF grey image, those regions where the AF is prevalently secondary to the GEFC were isolated. With this method, all those regions where the GEFC is at least equivalent to the REFC are thus masked. A basic problem with any image subtraction procedure is that the noise level in the resulting image is higher and can confound the analysis.14 For the latter reason, in order to compensate for the increase in noise produced by the subtraction process, a ‘Gaussian Blur’ filter set at ‘3’ was previously applied to all images undergoing the subtraction process. Finally, the processed images were ‘binarised’, reviewed by two Doheny Eye Institute graders (EB and SB), to identify areas exhibiting regions of strong GEFC signal following the subtraction feature. These regions of GEFC signal were correlated with OCT B-scans to define the anatomic origin on this signal. Each grader performed this correlation and interpretation separately. Graders later met to compare the level of agreement, and disagreements were resolved by further discussion and open adjudication to yield a single assessment for each case.
Results
Of the 28 eyes with late AMD and MA that were initially enrolled, 25 eyes (18 patients, five men) met the required image quality criteria and were used in the analysis. Three eyes were excluded due to poor image quality. Mean ±SD age of the patients enrolled was 83.0±6.5 years (range 70–93 years).
Table 1 shows the clinical characteristics of the analysed eyes. Of the investigated eyes, 11 out of 25 (44.0%) showed the absence of GEFC within the bed of the MA area, whereas 14 eyes (56.0%) were characterised by GEFC within the MA area. In the correlation between GEFC signals and OCT B-scans, the two graders agreed in their observations in 22 out of 25 eyes. The agreement for the remaining three eyes was obtained after open adjudication.
Clinical characteristics of the enrolled eyes.
Eyes with the presence of GEFC within the atrophy
Overall, the size, shape and configurations of foci of high GEFC within the MA were quite variable, but two patterns could be discerned: (i) multifocal GEFC signal (78.5%, 11 out of 14 eyes) (figure 2) and (ii) confluent GEFC signal (21.5%, three eyes) (figure 3). Of note, of the four neovascular AMD eyes with MA enrolled, only one eye was characterised by GEFC in the atrophic area, and a confluent GEFC pattern was observed.
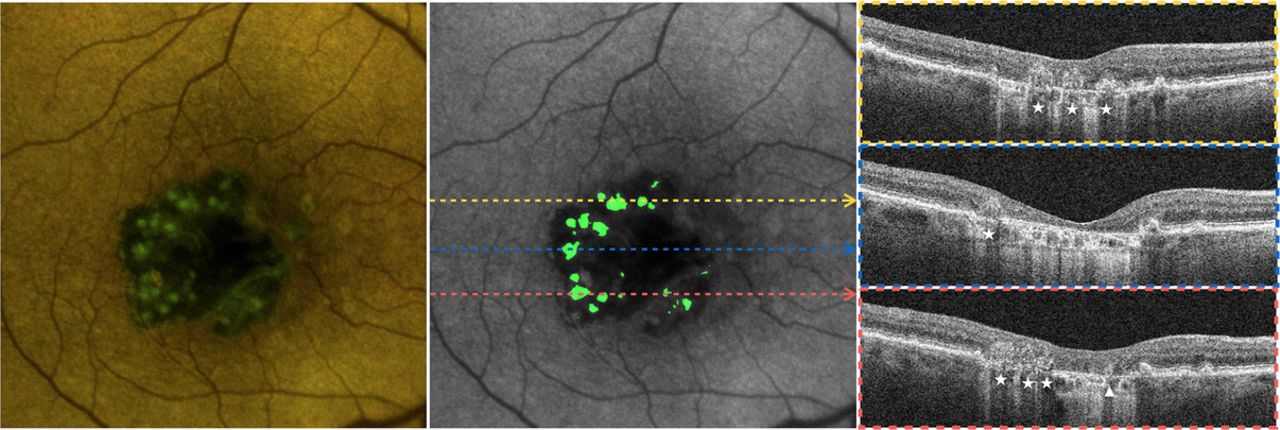
Autofluorescence and spectral domain optical coherence tomography (SD-OCT) of the eye #1 affected by geographic atrophy. The colour fundus autofluorescence image (left) shows a large central area of reduced red emission autofluorescence component—corresponding to the area of macular atrophy—where otherwise the green emission autofluorescence component (GEFC) was still present with a multifocal signal GEFC pattern. These observations were confirmed in the post-processing image (middle). SD-OCT scans (right) show that hyper-reflective material over the Bruch’s membrane well correlated with the distribution of GEFC. In this example, two different shapes characterised the identified hyper-reflective material: (i) clumpy-shaped (white arrowhead) and (ii) pyramidal-shaped (white star).

Autofluorescence and spectral domain optical coherence tomography (SD-OCT) of the eye #8 affected by neovascular age-related macular degeneration and macular atrophy (MA). The colour fundus autofluorescence image (left) shows a patchy area of reduced red emission autofluorescence component, which was consistent with an area of MA detected on the corresponding SD-OCT scans. In this area, the green emission autofluorescence component (GEFC) was still present, as confirmed by the post-processing image (middle), and showed a confluent signal pattern. SD-OCT scans (right) show that a continuous hyper-reflective band over the Bruch’s membrane well correlated with the distribution of the GEFC within the MA area.
When the colour FAF images were correlated with SD-OCT, all of these high GEFC regions were found to be topographically localised to within the bed of MA. In addition, these areas of high GEFC were observed to correspond to regions of subretinal hyper-reflective material overlying Bruch’s membrane within the bed of atrophy.
In eyes with a multifocal GEFC pattern, the multiple poorly demarcated green dots corresponded to clump-shaped hyper-reflective material over the Bruch’s membrane. In two eyes, well-demarcated green dots were visible, which corresponded to the presence of pyramidal-shaped hyper-reflective material (figure 2, table 1).
In contrast, in eyes with a confluent pattern of high GEFC signal, a contiguous hyper-reflective band over Bruch’s membrane could be observed in the bed of atrophy (figure 3, table 1).
Eyes without the presence of GEFC within the region of atrophy
Representative image of a patient with MA and without any evidence of GEFC is shown in figure 4. In 10 out of 11 eyes without GEFC, there was no evidence of hyper-reflective material above Bruch’s membrane in the OCT B-scans. However, in one eye, despite the absence of GEFC, clump-shaped hyper-reflective material was still observed on the SD-OCT scans (table 1).

Autofluorescence and spectral domain optical coherence tomography (SD-OCT) of the eye #7 affected by geographic atrophy. The colour fundus autofluorescence image (left) shows two main areas of reduced red emission autofluorescence component and green emission autofluorescence component (GEFC) respectively, which corresponded to the area of macular atrophy (MA) as detected with SD-OCT. The absence of GEFC within the MA area was also confirmed in the post-processing image (middle). The corresponding SD-OCT scans (right) show the absence of hyper-reflective material over the Bruch’s membrane.
Discussion
In this prospective, cross-sectional study, we evaluated the ‘colour’ FAF characteristics of AMD-associated MA using a 450 nm LED blue-light confocal FAF system. Overall, we observed that short-wavelength GEFC-emitting fluorophores could be observed within areas of MA where the strong REFC of lipofuscin was either absent or severely reduced.
FAF has been an area of interest in ophthalmic research for over 40 years. This imaging technique is used to record fluorescence, which may occur naturally in ocular structures or as a product of disease processes.15 RPE lipofuscin, which is a mixture of fluorophores, is considered to be the most intense source of AF in the posterior eye.16 Consequently, AF has been thought to be an effective surrogate for lipofuscin concentration in the RPE, and its most important use thus far has been to define the presence and extent of RPE atrophy. Major ocular fluorophores that have been identified in the posterior eye include N-retinylidene-N-retinylethanolamine (A2E), advanced glycation end products (AGE), coenzymes in redox reactions such as flavin adenine dinucleotide (FAD) and (less important) collagen/elastin.17 All these fluorophores have been investigated, and their excitation and emission spectra have been extensively characterised.13 The retinal fluorescence intensity in the long-wave emission range between 560 and 700 nm (red spectrum) is dominated by the fluorescence from lipofuscin and A2E. In contrast, all the other minor fluorophores contribute to the fluorescence intensity in the short-wavelength emission range 510–560 nm (green spectrum). In addition, these minor fluorophores are more excited and may contribute more strongly to the total fluorescence when the excitation wavelength is set at 450 nm.
Several studies have investigated eyes with AMD using FAF, which has been shown to be important for describing pathophysiological mechanisms as well as identifying markers predictive of disease progression.18 19 Using an excitation wavelength of 488 nm and an emission bandwidth of 500–700 nm, MA areas exhibit very low to extinguished AF signal as RPE cell death is accompanied by loss of lipofuscin. The latter aspect leads to a high contrast between the atrophic and perilesional retina. Furthermore, the contrast is even further increased by the commonly observed finding that the perilesional area shows hyper-AF.18–21
To the best of our knowledge, this is the first report of an evaluation of AMD-associated MA using a 450 nm wavelength FAF device. The combination of a lower excitation blue-light wavelength with the capability of isolating the green and red components of the emission spectrum allows these shorter-wavelength fluorophores to be studied for the first time in eyes with MA and to correlate these findings with anatomic alterations on OCT.
In our study, we were able to identify regions of GEFC signal within the bed of MA. To highlight or isolate the GEFC signal, we took the approach of subtracting the REFC from the total AF image. We found this approach to provide better isolation of areas of high GEFC signal within regions of atrophy compared with the GEFC image itself. Specifically, this approach allows the easy identification of those retinal areas where the REFC is absent or at least reduced (ie, where the RPE is atrophic), but short-wave fluorophores are still present. Although the distribution of GEFC within the MA area was variable, even with this small cohort, three morphological patterns could be easily discerned: ‘multifocal’, ‘confluent’ and ‘absent.’
Complementary OCT imaging allowed us to define the morphological correlates of these areas of GEFC. Specifically, we observed that high GEFC signal was always confined to the bed of atrophy and corresponded to thin areas of subretinal hyper-reflective material overlying Bruch’s membrane (with no RPE band). Fleckenstein et al 22 have studied with SD-OCT the morphological variations occurring in outer retinal layers of eyes with atrophic AMD. The authors described the presence of hyper-reflective elevations or accumulations (clump or pyramidal-shaped materials, respectively) within the atrophic area, as well as hyper-reflective plaques at the former RPE level (dotted-line formation). These alterations may represent residual sub-RPE deposits, occasional dissociated RPE cells, as well as varying stages of regressing drusen.22 23 It has been indeed postulated that regressing drusenoid material may remain in the bed of atrophy area for many years, and its presence may confirm drusen-related origin and evolution of the atrophic lesion.24 In our cohort of eyes, the presence of GEFC within the MA topographically correlated with the presence of subretinal hyper-reflective material on the corresponding SD-OCT scans. Moreover, in all but one eye without GEFC within the bed of MA, no hyper-reflective material could be observed over Bruch’s membrane. The lack of correlation in this single eye is uncertain, but may highlight a different quality or composition of fluorophores in the drusenoid material.
As noted above, the main short-wave fluorophores are FAD, AGE and collagen/elastin.13 While FAD is an intracellular molecule and is starved in mitochondria, AGE and collagen/elastin are extracellular proteins. Several studies have demonstrated that AGE are a group of extracellular proteins which play a role in ageing changes and are also involved in AMD pathogenesis.25 The formation and increase in AGE amount have been demonstrated to occur at sites of oxidative stress.26 Given that the increase in oxidative stress in AMD occurs at the level of the outer retinal layers, it is not surprising that the accumulation of AGE in soft drusen, basal laminar deposit and RPE has been demonstrated.25 The latter aspect may be further confirmed by the fact that a green shift of the fluorescence has been demonstrated corresponding to drusen in early/intermediate AMD eyes.27 Based on these observations, one potential hypothesis is that atrophy could be associated with the release of AGE, which is involved in the formation of the hyper-reflective material above the Bruch’s membrane and is the cause of GEFC in the MA area. Our results might then corroborate the hypothesis that the hyper-reflective material found in the MA is constituted by regressing drusen material and residual sub-RPE deposits and may be considered ‘trash’ or ‘debris’.
Further studies are in progress to investigate if the activation of further fluorophores, in addition to lipofuscin, may alter the reliability of the 450 nm blue-light FAF to detect the MA.
Our prospective pilot study has some limitations which should be considered when interpreting the findings. First, the sample size of the cohort is relatively small, which reduces the power of our analysis. Second, though we were able to correlate the GEFC to subretinal hyper-reflective material, we are not able to provide definitive insight into the composition of the material. Although we have speculated that AGE may be a component, other fluorophores could also contribute to the emission of GEFC. Nevertheless, it should be noted that FAD is an intramitochondrial molecule and its fluorescence has ever been used to detect changes in cellular metabolic activity. On the other hand, although collagen has a very weak fluorescence when excited with a 450 nm blue light, we are not able to exclude its presence in the hyper-reflective material detected on SD-OCT and its contribution to the GEFC signal.
In summary, using 450 nm short blue-light excitation wavelength and separate detection of both the green and red components of the AF signal, the composition of fluorophores in the eye can be probed in more detail. The bed of atrophy appears to demonstrate residual green component AF emission signal which corresponds to subretinal hyper-reflective material. Comparison with previous histological studies suggests that this material, which appears to be residual drusenoid material, may be composed in part of AGE. The predictive and prognostic values of these areas of GEFC signal are uncertain at this time. Future larger, longitudinal studies are necessary to better define the significance of these regions of GEFC within atrophic AMD lesions.
References
Footnotes
Handling editor Jost B Jonas
Contributors EB, JL and SRS: conception and design of the study. EB, JL, SB and SRS: patients’ enrolment and data acquisition. EB, JL, SB, AU and SRS: data analysis. All authors: interpretation of data. EB: drafting the article. PL, GS and SRS: revising it critically for important intellectual content. All authors: final approval of the version to be published.
Competing interests PL: financial support—Bayer, Centervue, Genentech, Novartis, Roche; GS: financial support—Novartis, Alcon, Bayer, Allergan, Boehringer Ingelheim, Genentech, Roche, Zeiss Meditec, Heidelberg Engineering, Optos, Centervue; SRS: financial support—Allergan, Carl Zeiss Meditec, Genentech, Iconic, Novartis, Optos, Optovue, Regeneron, Thrombogenics.
Patient consent Detail has been removed from this case description/these case descriptions to ensure anonymity. The editors and reviewers have seen the detailed information available and are satisfied that the information backs up the case the authors are making.
Ethics approval The study was approved by the UCLA institutional review board.
Provenance and peer review Not commissioned; externally peer reviewed.
Presented at 17th EURETINA Congress, Barcelona, Spain, EU.
Linked Articles
- At a glance