Article Text

Abstract
Aims To evaluate quantitative metrics of the retinal microvasculature in eyes with diabetic retinopathy (DR) using various en face swept-source optical coherence tomography angiography (SS-OCTA) image sizes.
Methods Non-segmented and segmented images were acquired using an SS-OCTA device (PLEX Elite 9000; Carl Zeiss Meditec, Dublin, California, USA). The scanning protocols included the 3×3 mm, 6×6 mm and 12×12 mm fields of view. Quantitative analysis of the perfusion density (PD), vessel length density (VLD) and fractal dimension (FD) was performed. The area under the receiver operating characteristic curve was estimated to assess the ability of each image size to predict DR.
Results This prospective, cross-sectional study included 60 eyes, (non-DR, 13 eyes; non-proliferative DR (NPDR), 24 eyes; proliferative DR (PDR), 23 eyes) of 46 patients with diabetes and 21 eyes of 16 healthy individuals. In the 12×12 mm images, the PD of healthy individuals was significantly greater than that of patients with NPDR or PDR for all layers (NPDR, p<0.05; PDR, p<0.001 0.001; FD, p<0.001) or PDR (VLD, p<0.001; FD, p<0.001 for all layers). The results were similar for the 3×3 mm and 6×6 mm images. Overall, PD, VLD and FD progressively decreased with worsening DR severity in segmented and non-segmented layers for all SS-OCTA scan sizes. For detecting DR, 3×3 mm images best predicted DR for all evaluated quantitative parameters.
Conclusions Vascular changes in DR can be monitored in detail through quantitative evaluations that combine different SS-OCTA scan sizes and parameters.
- Imaging
- Retina
Statistics from Altmetric.com
Introduction
Diabetic retinopathy (DR) is a leading cause of visual impairment and blindness worldwide.1 2 Fluorescein angiography is the gold standard for evaluating retinal vascular alterations in DR.3 However, as fluorescein angiography takes several minutes and requires intravenous dye injection, which may cause side effects, this technique is not suitable as a screening tool or for frequent longitudinal assessments.4 Since the number of patients with DR is expected to increase, and as early detection and intervention is useful for preventing severe vision loss, new methods of evaluating the microvascular status of patients with DR are required.5
Optical coherence tomography angiography (OCTA) is a useful method for visualising the retinal microcirculation in a depth-resolved fashion, allowing the retinal superficial and deep vasculatures to be studied separately.6 Furthermore, since the contrast between the retinal vessels and surrounding tissue is high, OCTA permits the quantitative analysis of retinal vascular changes. Commonly used parameters to quantify retinal vasculature include vessel density (VD) or perfusion density (PD),7 blood flow index,7 skeletonised density (SD) or vessel length density (VLD),6 and fractal dimension (FD).8 A prior study using spectral-domain OCTA8 found that decreasing capillary density (VD and SD) was associated with worsening DR. Moreover, recent quantitative studies have demonstrated that swept-source OCTA (SS-OCTA) images can reveal reductions in VD in the superficial and deep retinal layers (SRL/DRL) in eyes with DR compared with healthy eyes and the eyes of patients with diabetes without DR.9 10 A limitation of current OCTA technology, however, is the limited scanning area. Indeed, many previous DR studies focused on small 3×3 mm OCTA images.11 Newer SS-OCTA devices are able to scan larger fields with a single acquisition.12 Since vascular alterations in DR extend beyond the posterior pole, these wider-field acquisitions may be useful for evaluating the retinal vasculature in patients with DR. However, few reports evaluating quantitative retinal vascular parameters using such wide-field SS-OCTA scans exist.
Here, we evaluated the vascular density (PD and VLD) and morphology (FD) at the SRL and DRL in patients with varying DR severities and compared the findings with those from healthy subjects using various en face SS-OCTA image sizes.
Materials and methods
Study population
This study adhered to the tenets set forth in the Declaration of Helsinki. Written informed consent was obtained from all participants. We evaluated 60 eyes of 46 patients with diabetes and 21 eyes of 16 healthy individuals. All participants were recruited prospectively from Doheny Eye Center at the University of California, Los Angeles (UCLA) and the Shinshu University School of Medicine between December 2016 and May 2017. All patients had a known diagnosis of diabetes mellitus, as confirmed through laboratory testing by their primary care physician. The DR severity was categorised into none, mild non-proliferative DR (NPDR), moderate NPDR, severe NPDR and proliferative DR (PDR) based on the International Clinical Diabetic Retinopathy Severity Scale.13
All participants underwent comprehensive ophthalmological examinations, including slit-lamp biomicroscopy, dilated ophthalmoscopy, colour fundus photography and SS-OCTA. Data on age, sex, previous haemoglobin A1c (National Glycohaemoglobin Standardization Program) levels and diabetes duration were collected from medical records.
Swept-source optical coherence tomography angiography
Images were obtained using an SS-OCT device (PLEX Elite 9000, Carl Zeiss Meditec, Dublin, California, USA). For each eye, fovea-centred images were acquired at three scan sizes (3×3 mm, 6×6 mm and 12×12 mm). Automated layer segmentation performed by the OCT instrument software produced three horizontal depth-resolved retinal slabs consisting of the SRL, extending from the inner limiting membrane to the inner plexiform layer, the DRL, extending from the inner plexiform layer to the outer plexiform layer, and the outer retinal layer, extending from the outer plexiform layer to 37 µm below the retinal pigment epithelium. A full-thickness slab extending from the inner limiting membrane to 70 µm above the retinal pigment epithelium was also obtained for analysis. En face images of SRL, DRL and the full-thickness slab were exported (1024×1024 pixels) for analysis. Participants were excluded if their images exhibited one or more of the following: low signal strength (≤6), blink artefacts, poor fixation leading to motion or doubling artefacts, media opacity obscuring visualisation of the vasculature, and/or segmentation errors.
Quantitative measurements
To quantify PD, VLD and FD, all original en face SS-OCTA images were converted into binary images using ImageJ (National Institutes of Health, Bethesda, Maryland, USA) according to previously reported methods, with modifications.8 14 Briefly, an area within the foveal avascular zone was selected in each image with a circle of fixed diameter (100, 50 and 25 pixels in 3×3 mm, 6×6 mm and 12×12 mm images, respectively) to establish the baseline signal-to-noise ratio for global thresholding and to ensure consistency in the background luminance for all images. Images were then processed with a top-hat filter (window size: 12 pixels). Each image was processed separately to create two distinct binarised images; one was processed with a Hessian filter, followed by global thresholding using Huang’s fuzzy thresholding method, and the other (duplicate) image was binarised through median local thresholding. Lastly, the two binarised images were combined, generating the final image in which only those pixels that existed on both binarised images were included. Using the binary image, PD was calculated as the ratio of the area occupied by vessels (white pixels) divided by the total image area (all pixels). After skeletonisation of the binarised image, VLD which stands for the vessel length per unit area, was computed as described previously.6 8 We calculated FD on the skeletonised image using the box-counting method with Fractalyse (ThéMA, Besançon, Cedex, France), as described previously.15 FD provides an index of the branching complexity of the vascular network, and images with more complex vessel branching patterns have a higher FD.
Statistical analysis
We measured PD, VLD and FD on SRL, DRL and full-thickness retinal slabs for each of the three scan sizes. All images were analysed in random order and compared between the participant groups by two experienced observers (YT, TM). The intraclass correlation coefficient (ICC) was used to evaluate interobserver agreement. Since the ICCs between the two readers were consistently >0.8, analyses were performed with measurements recorded by just one observer. The area under the receiver operating characteristic (ROC) curve (AUC) was estimated to determine the ability of each image size and parameter to predict DR. Comparisons were performed with Student’s t-tests or analyses of variance (ANOVAs) with post hoc Tukey’s honest significant difference tests for multiple comparisons. Statistical significance was set at p<0.05. All analyses were performed using SPSS V.24.0 (IBM, Armonk, New York, USA).
Results
Table 1 presents the participants’ demographic data. The age and sex distributions of healthy individuals and patients with diabetes were not significantly different. Of the 24 eyes with NPDR, 9, 4 and 11 were mild, moderate and severe, respectively. Figure 1 shows representative full-thickness slab SS-OCTA images for the three scan sizes along with the postprocessed images used for analysis. SS-OCTA images for the SRL and
Demographics of the healthy participants and patients with diabetes

Representative full-thickness en face swept-source optical coherence tomography angiography (SS-OCTA) images of control eyes and eyes with different stages of diabetic retinopathy at the three scan sizes that were used for quantitative analysis (3×3 mm, 6×6 mm, 12×12 mm). Original SS-OCTA images (A). Contrast-enhanced binarised (B) and skeletonised (C) images of the retinal vasculature. DR, diabetic retinopathy; NPDR, non-proliferative diabetic retinopathy; PDR, proliferative diabetic retinopathy.
DRL slabs are shown in online supplementary figures 1; 2. For all scan patterns, the binarised and skeletonised images showed progressively more abnormal retinal vasculature with increasing DR severity, manifested as decreased vascular density and branching in all examined layers.
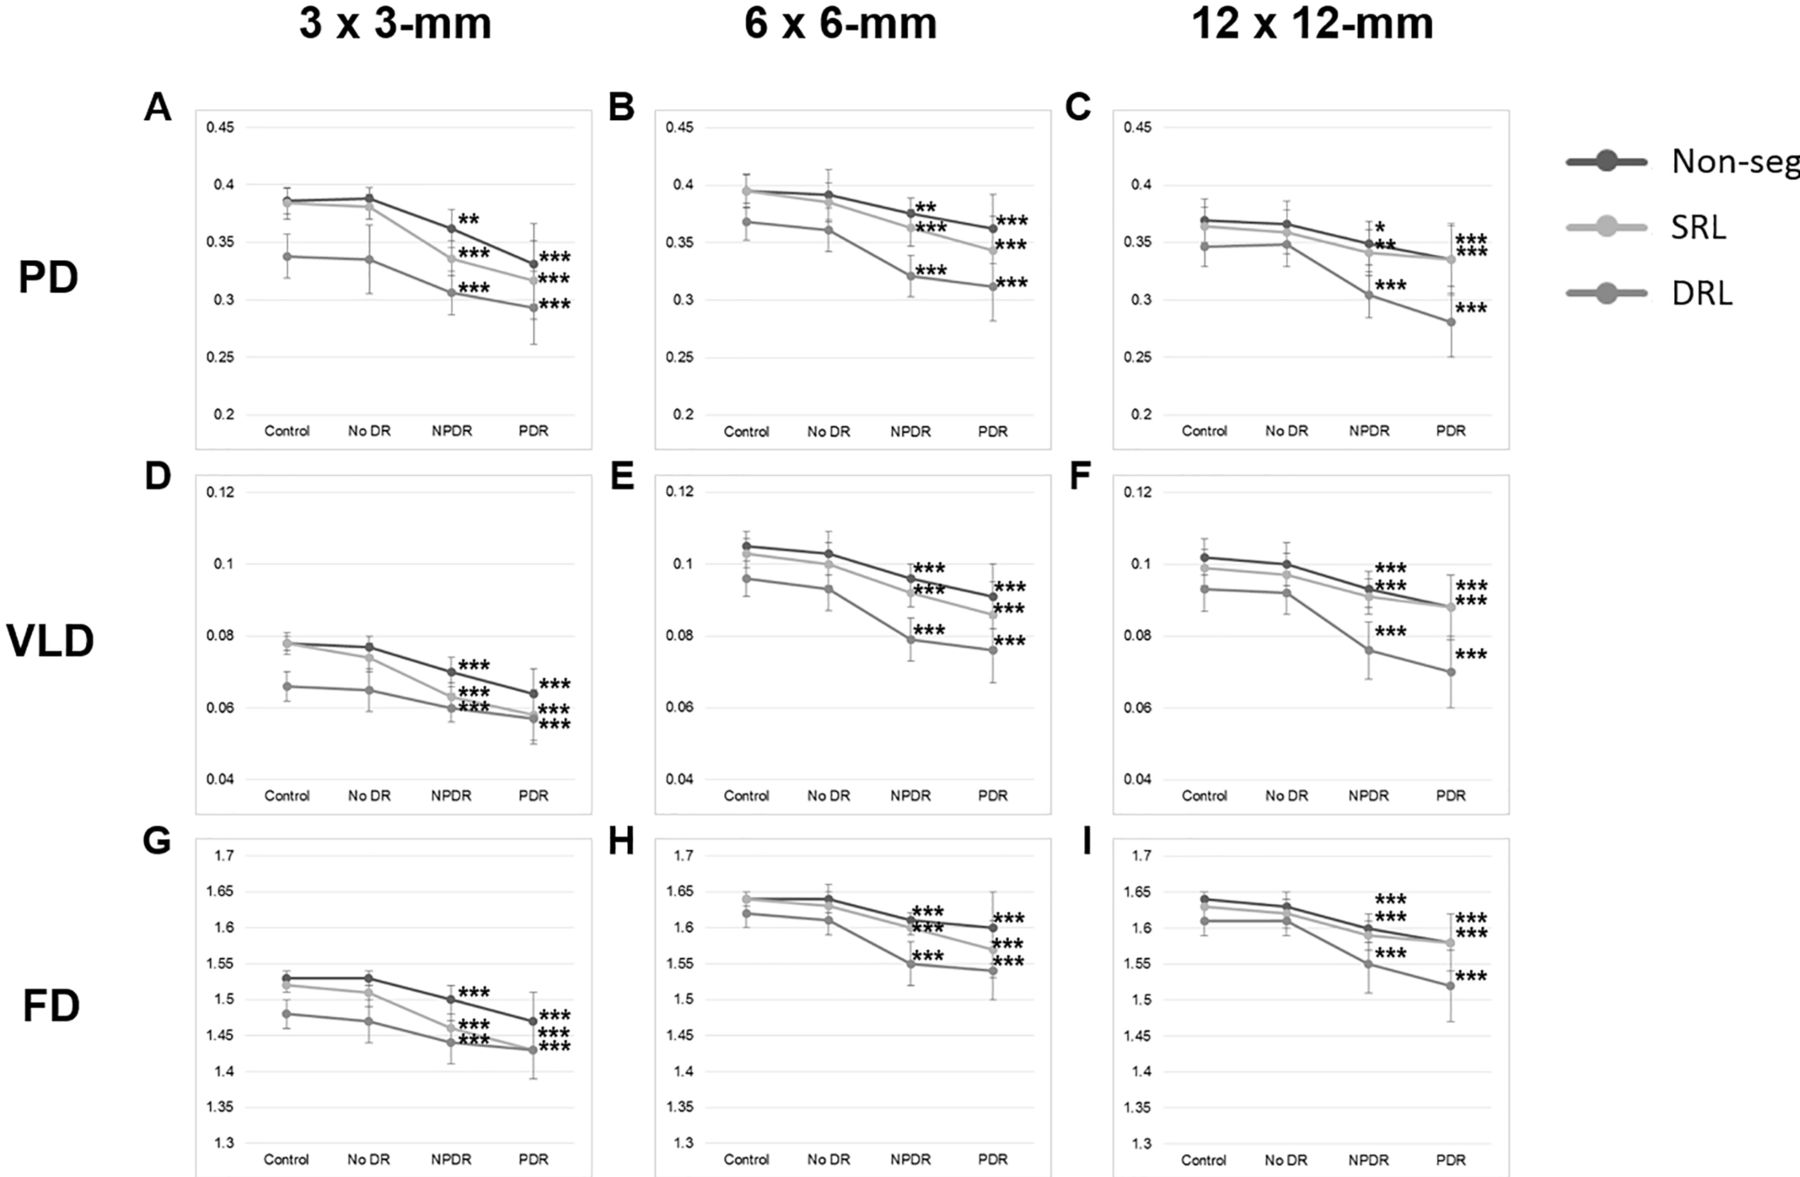
Table 2 shows the mean PD, VLD and FD for the three examined layers and image sizes, while online supplementary table 1 provides the results of the ANOVAs with post hoc Tukey’s tests. In the 12×12 mm images, PD was significantly greater in healthy eyes than in eyes with NPDR or PDR for all layers (NPDR: p<0.05, PDR: p<0.001); no difference in PD (all layers) was found between healthy and diabetic eyes without DR. The VLD and FD in all layers were significantly greater in healthy eyes than in eyes with NPDR (VLD: p<0.001, FD: p<0.001) or PDR (VLD: p<0.0001, FD: p<0.001); no significant differences in these parameters were noted between healthy and diabetic eyes without DR. The results were similar for the 3×3 mm and 6×6 mm images (table 2, figure 2). Overall, PD, VLD and FD progressively decreased with worsening DR severity in all slabs for all scan sizes.
Supplemental material
Quantitative analyses results for each participant group and swept-source optical coherence tomography angiography scan size

Quantitative analyses of vascular density and morphology from the three swept-source optical coherence tomography angiography image scan sizes. Graphs of mean (±SD deviation) PD (A–C), VLD (D–F) and FD (G–I) for each scan size are shown. Reductions in PD, VLD, and FD in both the NPDR and PDR groups were observed compared with healthy control eyes. *P<0.05, **p<0.01, ***p<0.001. DR, diabetic retinopathy; DRL, deep retinal layer; FD, fractal dimension; Non-seg, non-segmented layer; NPDR, non-proliferative diabetic retinopathy; PD, perfusion density; PDR, proliferative diabetic retinopathy; SRL, superficial retinal layer; VLD, vessel length density.
To assess the effects of diabetic macular oedema (DMO), we compared eyes with and without DMO among patients with the same DR severity (online supplementary table 2). In the NPDR group, 46% (11/24) had DMO, with 3×3 mm images showing significantly lower PD, VLD and FD in the DRL (p=0.011, 0.030 and 0.029, respectively). This difference was not observed in the other SS-OCTA image sizes. In the PDR group, 48% (11/23) of eyes had DMO and were not significantly different from eyes with PDR without DMO (all layers and scan sizes).
Supplemental material
In the ROC analyses, the AUC was used to compare the abilities of each parameter and SS-OCTA scan size to predict DR (figure 3). For detecting DR, the AUC for PD in 3×3 mm, 6×6 mm and 12×12 mm full-thickness retinal SS-OCTA images was 0.924 (95% CI 0.896 to 0.980) with a sensitivity of 85% and specificity of 85% at a threshold of 0.377, 0.829 (95% CI 0.7338 to 0.9223) with a sensitivity of 68% and specificity of 93% at a threshold of 0.393, and 0.7972 (95% CI 0.6992 to 0.8953) with a sensitivity of 77% and specificity of 76% at a threshold of 0.358, respectively. Moreover, among the cases where the PD for all retinal layers was higher than the threshold value in 3×3 mm images, one eye with NPDR and two eyes with PDR had PD values that were lower than the threshold in 12×12 mm retinal images (online supplementary figure 3). Conversely, the AUCs for VLD and FD increased to 0.957 (95% CI 0.921 to 0.994) and 0.900 (95% CI 0.829 to 0.970), respectively, in 3×3 mm images; 0.895 (95% CI 0.828 to 0.962) and 0.958 (95% CI 0.922 to 0.994), respectively, in 6×6 mm images; and to 0.909 (95% CI 0.841 to 0.977) and 0.929 (95% CI 0.877 to 0.982), respectively, in 12×12 mm images.
Supplemental material

Receiver operating characteristic analyses comparing the accuracy of each swept-source optical coherence tomography angiography image scan size and parameter in predicting the presence of diabetic retinopathy. Graphs of mean PD (A–C), VLD (D–F) and FD (G–I) for each scan size are shown. The black box lists the area under the curve, 95% CI, p value, specificity, and sensitivity when the threshold is set to the indicated value. AUC, area under the ROC curve; FD, fractal dimension; PD, perfusion density; ROC, receiver operating characteristic; VLD, vessel length density.
All ICCs between the two graders for PD, VLD and FD in the three scan sizes were between 0.886 and 0.998 (online supplementary table 3).
Supplemental material
Discussion
This study examined the retinal vasculature in the eyes of healthy individuals and patients with diabetes with and without DR using SS-OCTA images of various scan sizes. Patients with DR had significantly lower PD, VLD and FD than did healthy individuals regardless of the retinal slab and scan size used. To our knowledge, our study is the first to quantitatively evaluate the retinal vasculature in patients with DR using wide-field SS-OCTA images. Importantly, we observed that a lower PD, VLD and FD could be identified in patients with DR in all layers and with all evaluated scan sizes.
This study also assessed the effects of DMO. We found significant differences in all parameters between NPDR eyes with and without DMO in the DRL of the 3×3 mm SS-OCTA images. This difference was not observed to the same extent in PDR eyes for the SRL or full-thickness retina, nor was it seen in the 6×6 mm and 12×12 mm SS-OCTA images. Several potential explanations for these apparent discrepancies exist. First, morphological evidence supports that DMO is largely localised to the DRL.16 17 Second, the presence of macular oedema may have impaired visualisation of the deeper circulation and artefactitiously altered deeper microcirculation assessments. Third, as DMO may be localised to relatively small regions of the macula, alterations caused by such limited areas of oedema may not have been large enough to significantly affect measurements from wider scans. Thus, based on our findings, it would seem that the 3×3 mm pattern may be the most useful scan size for evaluating vascular alterations in eyes with DMO. However, our cross-sectional study design prohibits us from definitively concluding whether DMO affects the retinal vasculature or vice versa, as we did not examine patients before and after DMO development. Longitudinal studies are required to address this question.
Because DR may cause widespread damage to the retinal microvasculature, we examined the ability of the different image sizes to predict vascular structure alterations in DR. Perhaps surprisingly, we observed that 3×3 mm images were the best for predicting the presence/absence of DR. One potential contributing factor is image quality. Previously, we observed lower VDs in 6×6 mm vs 3×3 mm spectral-domain OCTA images, likely because 6×6 mm scans cover a larger territory with the same number of A-scans, and thus have a lower effective resolution and lower VDs, than do 3×3 mm scans.18 Similarly, since 6×6 mm and 12×12 mm SS-OCTA images have lower resolutions than do 3×3 mm SS-OCTA images, they may also have a lower resolution with which to identify microvasculature damage. The present results support this concept, as we observed a clear reduction in image quality in 3×3 mm crop-outs from 6×6 mm and 12×12 mm images from the macula of the same eye when compared with the native 3×3 mm acquisition (online supplementary figure 4). A second contributing factor is the proportion of larger blood vessels included in each image size. Larger blood vessels occupy more of the image as image size increases. The pathology of DR involves microvasculature-induced damage; hence, the effects of smaller vessels may become increasingly masked as the proportion of the image that includes larger blood vessels increases. This explanation is further supported by the fact that when using VLD (which unlike PD, is not influenced by blood vessel diameter), the AUC increases for all image sizes, but the increase is more pronounced in 12×12 mm images. A third contributing factor is the proportion of fovea avascular zone (FAZ) area relative to total scan area. Compared with the 6×6 mm and 12×12 mm images, the proportion of FAZ area is higher in the 3×3 mm images. Some reports have noted that FAZ area in PDR was significantly larger than in healthy subjects. Additionally, they have reported that FAZ and PD are significantly correlated.19 The final contributing factor or explanation is that DR-related microvasculature damage may actually begin around the macula, and thus the 3×3 mm image would be expected to have the best predictive sensitivity for DR. Longitudinal studies using wide-field SS-OCTA images are needed to evaluate this hypothesis.
Supplemental material
As we hypothesised that the presence of DMO may impact our results, we also examined DR prediction for the subset of subjects without DMO using ROC curve analysis. Even in this cohort, all OCTA parameters (ie, PD, VLD and FD) from 3×3 mm images continued to best predict DR, similar to the finding in patients with DMO (online supplementary table 4).
Supplemental material
Although our findings imply that wide-field OCTA images are not necessary for evaluating microvascular alterations related to the DR severity, this may not be entirely true. It is known that in some patients with diabetes, microvascular alterations may be predominantly peripheral.20 Here, three eyes had PDs below the threshold value in 12×12 mm SS-OCTA images, despite having a PD above the threshold value from full-thickness slabs in 3×3 mm SS-OCTA images (online supplementary figure 3). It may be difficult to identify retinal vasculature alterations using only 6×6 mm SS-OCTA images in such cases, and thus wider-field SS-OCTA images may be needed. Furthermore, the AUC for PD in the full-thickness retinal slab in 3×3 mm SS-OCTA images was lower than the AUC for FD in the full-thickness retinal slab in 12×12 mm SS-OCTA images; therefore, the latter was better able to predict DR. Our results suggest that DR pathology can be evaluated in more detail by combining various SS-OCTA scan sizes and parameters.
This study has several limitations. One is our sample size. While it would have been ideal to divide the NPDR group into three severity subgroups for analysis, the sample sizes would have been too small (ie, underpowered); therefore, we treated all NPDR cases as a single cohort. Another limitation is that this cohort included eyes that had and had not received panretinal photocoagulation (PRP) laser. As previous research using laser speckle flowgraphy identified blood flow decreases after PRP,21 PRP may have confounded our results. However, our cross-sectional design prohibited us from evaluating the pathological microvascular alterations that were specifically related to the presence/absence of DMO or the effects of PRP treatment. Thus, larger, longitudinal studies would be important for the future.
In summary, our study suggests that while microvascular alterations may be observed in eyes with DR, the severity and pattern of the observed alterations may be affected by the size and resolution of the OCTA acquisition scan; thus, a combination of scan patterns/sizes may provide additive useful information. Our findings may aid in the design of scan acquisition and analysis protocols for future prospective studies.
Supplemental material
Supplemental material
References
Footnotes
Contributors TH, TM and SS: study conception, design, analysis, interpretation of data, drafting and revising, and final approval. JK, YT and HK: data acquisition, drafting and revising, and final approval.
Funding The authors have not declared a specific grant for this research from any funding agency in the public, commercial or not-for-profit sectors.
Competing interests SS is a consultant for and receives research support from Optos and Carl Zeiss Meditec, serves as a consultant for Centervue, and has access to research instruments provided by Heidelberg Engineering, Topcon Medical Systems, Optos, Carl Zeiss Meditec, Nidek and Centervue.
Patient consent Obtained.
Ethics approval The Institutional Review Board of the University of California, Los Angeles and the ethics committee of the Shinshu University School of Medicine (approval number 2044) .
Provenance and peer review Not commissioned; externally peer reviewed.
Linked Articles
- At a glance