Article Text

Abstract
AIMS To document the phenotype of an autosomal dominant macular dystrophy diagnosed as having North Carolina macular dystrophy (NCMD) in this British family, and to verify that the disease locus corresponds with that of MCDR1 on chromosome 6q.
METHODS 37 family members were examined and the phenotype characterised. DNA samples from the affected members, 19 unaffected and five spouses, were used to perform linkage analysis with six microsatellite marker loci situated within the MCDR1 region of chromosome 6q.
RESULTS Every affected family member had lesions characteristic of NCMD, which developed early in life and usually remain stable thereafter. Although fundus changes are evident in the periphery, all tests revealed that functional loss is restricted to the macula. Some patients with large macular lesions had good visual acuity with fixation at the edge of the lesion at 5° eccentricity. Significant linkage to the MCDR1 locus on chromosome 6q was obtained with three marker loci, with a maximum lod score of 5.9 (q = 0.00) obtained with D6S249.
CONCLUSION This family has the typical phenotype NCMD, and the causative gene was linked to the disease locus (MCDR1) on chromosome 6q. Early onset and localisation of the disease to the central macula allow specialisation of eccentric retina in some eyes with resultant good visual acuity.
- macular dystrophy
- linkage analysis
- psychophysics
Statistics from Altmetric.com
The pathogenetic mechanisms leading to autosomal dominant macular dystrophies are not yet well understood. This disease group presents a spectrum of clinical conditions, which vary in their age of onset, speed of progression, and visual prognosis. Recently several macular dystrophies have been linked to their disease gene or locus.1-12 As a consequence single nosological entities can be identified, and concepts concerning pathogenetic mechanisms formulated.
Autosomal dominant North Carolina macular dystrophy (NCMD) has a distinct phenotype,13-15 and its genetic locus is known.16-25 It is usually non-progressive with early onset. It was first characterised in North Carolina, where affected individuals descended from three Irish brothers who emigrated there in the 1830s. Affected families unrelated to the original NCMD pedigree have been found in Texas, central America, and France, and have all been mapped to the MCDR1 locus on 6q.18-24 This locus has been refined to a 3.1 centiMorgan (cM) interval between D6S249 and D6S283.20
The phenotype, which is variable, has been divided into three grades of severity. Grade I comprises fine drusen confined to the central 3° of the central macula, and mild pigmentary changes at the level of the pigment epithelium. In grade II there is confluent elevated subretinal material with or without pigmentary changes. Grade III denotes the presence of well demarcated chorioretinal atrophy at the central macula, with hypertrophic fibrous tissue and pigmentation on the edge of the lesion. Progression of disease is believed to be uncommon after the age of 12 years. Although the phenotype is distinctive, it shares some common features with bifocal chorioretinal atrophy in which the gene co-localises with MCDR1.4
In a British NCMD family spanning five generations we have sought to confirm the diagnosis by linkage to the disease locus, and to characterise the phenotype.
Materials and methods
SUBJECTS
After the clinical diagnosis of NCMD had been made in family members at Moorfields Eye Hospital, the extended family was visited at home, and affected members identified by ophthalmoscopy and the fundi photographed. Ten out of the 12 affected members in generations III, IV, and V gave written consent to undergo further clinical testing at the Institute of Ophthalmology and Moorfields Eye Hospital.
PHENOTYPE CHARACTERISATION
Full ophthalmic examination, colour fundus photography of the macula and periphery, and fluorescein angiography were undertaken. The flash and pattern evoked electroretinograms (ERG) and electro-oculograms (EOG) were recorded in eight patients according to a standard protocols.26-28 Colour vision testing was performed on each eye using a television stimulator and computer graphics system.29 Photopic and scotopic visual fields were performed with a Humphrey field analyser using published protocols.30-32 More detailed scotopic retinal function was documented using fine matrix mapping as described.33For this study, retinal sensitivity was tested at 100 positions on a 10 × 10 square matrix over a 9° × 9° test field. Subsequent processing of the data produced a three dimensional representation of rod thresholds, the higher the elevation from baseline the greater the loss of function compared with established normal values.
Fixation was verified by scanning laser ophthalmoscopy (SLO).
GENOTYPING AND LINKAGE ANALYSIS
EDTA blood samples were obtained from 13 affected members, 19 unaffected members, and five spouses for linkage analysis. DNA was extracted from these samples with a Nucleon II extraction kit (Scotlab Bioscience). Genotyping was performed with six microsatellite marker loci as described previously.4 Data were collected usinglinksys 3.1,34 and two point linkage analysis was performed using the mlink subprogram of thelinkage package 5.10.35 Allele frequencies were calculated from the five spouses in the family. The NCMD phenotype in this family was analysed as an autosomal dominant trait, with complete penetrance, infantile onset, and a frequency of 0.001 for the affected allele.
Results
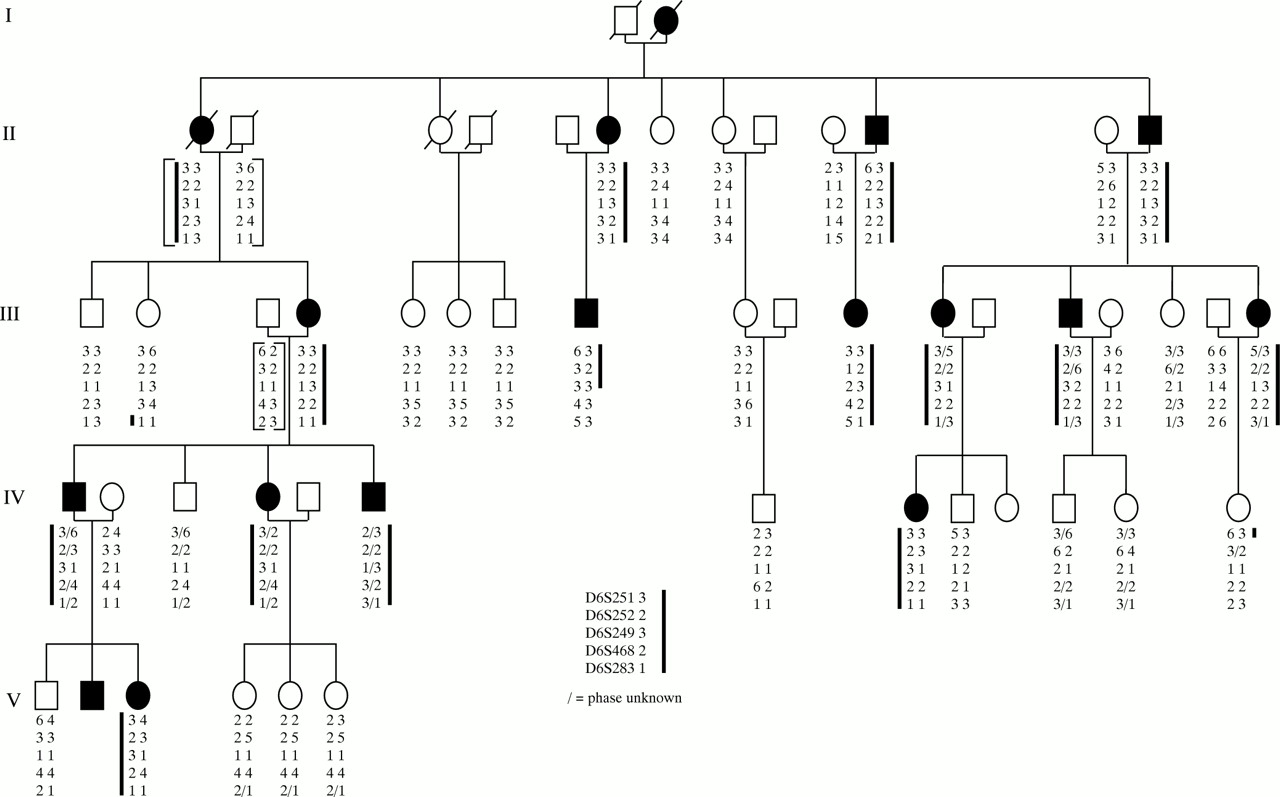
The pedigree demonstrates the characteristics of dominant inheritance (Fig 1). Characteristic grade I macular changes were seen in eight patients (II-6, II-11, III-4, III-8, III-14, III-18, IV-4, and IV-6 (Fig 2A). In addition, some eyes showed mild retinal pigment epithelium (RPE) changes. All patients had drusen-like deposits in the peripheral fundus, often very prominent and in radial alignment (Fig2B). The visual acuity in these patients was normal (Table 1). All electrodiagnostic tests were normal except for a slightly reduced EOG in one eye (patient III-4). This patient also had abnormal colour vision especially in the tritan axis. Patients with grade I lesions showed normal dark adapted thresholds at the two locations tested. Dark adaptation showed a distinct rod-cone break, and the recovery to prebleach level was complete within 30 minutes.

Pedigree and haplotype results of six microsatellite marker loci situated on chromosome 6q. Solid symbols indicate affected and open symbols indicate unaffected members of the family. Slashed symbols show deceased individuals. The brackets indicate inferred haplotypes for individuals II-1, II-2, II-13, and III-3. The heavy line indicates the haplotype that appears segregate with disease (a small slash indicates where the phase of the alleles is uncertain). Recombinant IV-13 localises the disease gene telomeric to D6S251 and recombinant III-8 localises the disease gene centromeric to D6S468.


A grade I lesion with drusen-like changes in the macular of patient III-8 (A). In the periphery are radial alignment of white dots (B). Patient IV-8 had a grade I lesion in the left eye (C), and a grade II lesion in the right (D). Grade III lesion in patient V-2 showing well demarcated chorioretinal atrophy at the macula, with white fibrous tissue and pigmentation on the edge of the lesion (E, F). An overlay of the SLO guided fixation test and the fundus photography reveals left eye fixation at the nasal rim of the macular lesion at about 5° of eccentricity (G).
Clinical data
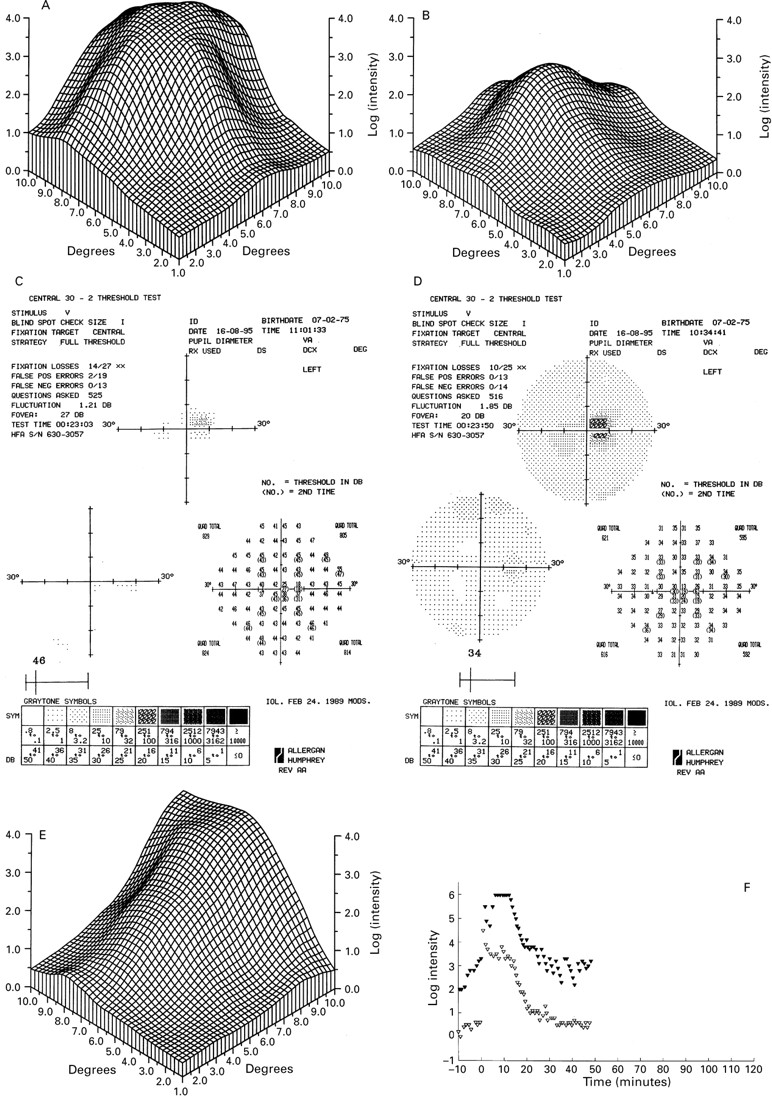
Only one 15 year old patient had grade II disease (IV-8) (Fig 2C and D). The right eye had yellowish subretinal material at the macula and a visual acuity of 6/12. The lesion in the other eye resembled grade I disease with densely packed drusen and a visual acuity of 6/6. Drusen were also found in the fundus periphery. The different fundus appearance is reflected in the fine matrix mapping which shows an up to 3 log units loss of the scotopic threshold in the right eye (Fig 3A), while the left eye has normal thresholds (Fig3B).

Fine matrix mapping on the left eye of patient IV-8 with a grade II lesion shows up to 3 log units sensitivity loss (A), the right eye with a grade I has normal sensitivities (B). In patient V-2 with a grade III lesion, perimetric tests show a sharply demarcated central sensitivity loss of up to 20 dB in the scotopic (C) and photopic function (D) and displacement of the blind spot. There was marked sensitivity loss on fine matrix mapping (E). Dark adaptation curve reveals elevated prebleach sensitivities at the edge of the scotoma (closed symbols), normal sensitivities at 9° (open symbols), and normal recovery kinetics (F).
Grade III lesions (Fig 2E) were diagnosed in four family members, two of them in their 40s and two in their 20s (II-12, IV-1, V-2, and V-3). Visual acuities ranged from 6/9 to 6/60, and were always asymmetrical (Table 1). Ophthalmoscopy showed deep, large circumscribed excavated lesions up to 3 disc diameters wide within the macular region. Atrophy involved the neuroretina as well as RPE and choriocapillaris. Some lesions had hyperpigmentation within the atrophic area, and white scar tissue on the rim of the lesion. Fluorescein angiography showed the complete loss of pigment epithelium and choriocapillaris within the lesion, allowing clear visualisation of the larger choroidal vessels (Fig 2F). As with all the other affected patients white dots in the periphery of the fundus were present.
The patients had remarkably stable disease. In all with grade III lesions the disorder had been diagnosed in the first decade of life, and the vision was stable in all but two patients following diagnosis. Patient III-12 remembers gradual deterioration of vision from the age of 8 years when a “scar” was diagnosed in her right eye, until the age of 30 years, and now has grade III lesions in both eyes. At the age of 10 years her daughter was described as having “mottling and dots”. Seven years later she has a grade II lesion in the right eye and a grade I lesion in the left eye.
In addition, the two young patients with grade III lesions showed very similar findings to their father. The father, IV-1, at 49 years had 6/9 vision in one eye and SLO guided fixation at the nasal edge of the lesion. Areas of diminished photopic and scotopic sensitivity in the central retina could be reliably mapped with the Humphrey field analyser. They were sharply demarcated and corresponded well with the fundus lesion. Fine matrix map showed sensitivity loss in scotopic threshold measurements by 2.5 log units centrally. However, eccentrically the prebleach dark adapted rod sensitivity was normal, as was recovery from bleach. Flash ERGs were normal, and the EOG light rise was slightly depressed in one eye.
Both his son (V-2) and daughter (V-3) had normal flash ERG, EOG findings, and colour vision. Both had fixation at the edge of the grade III lesion in the good eye, at 5° nasal to the anatomical fovea (Fig2G). Visual acuity in this eye was 6/9 that would normally imply fixation within 1° of the foveola.36 37 In his son perimetric tests showed a sharply demarcated loss of scotopic and photopic function corresponding with the fundus lesion (Fig 3C and D), which reflected eccentric fixation. Fine matrix mapping showed up to 3 log units loss, corresponding well with the location of the lesion (Fig3E). On dark adaptation testing his scotopic threshold measurement prebleach sensitivities were elevated at the edge of the scotoma, and normal at 9° of eccentricity; kinetics of recovery from bleach was normal at both sites (Fig 3F).
LINKAGE ANALYSIS
Genotyping was performed with six microsatellite marker loci and the two point lod scores are presented in Table 2. Significant linkage was obtained with three of these marker loci, and a maximum lod score of 5.90 (q=0) was obtained with D6S249.
Linkage analysis
Examples of the haplotypes that define the chromosomal interval for the disease-causing gene are indicated in Figure 1. The unaffected individual, III-2, has the affected allele for D6S283, placing the disease gene centromeric to this marker locus. A further refinement can be made as the affected individual III-8 is recombinant for D6S283, GRIK2 “TAA”, and D6S468. Thus, the disease gene is located centromeric to D6S468. The unaffected individual, IV-13, has the affected allele for D6S251 which places the disease gene telomeric to this marker locus. Thus, the haplotype analysis in our NCMD family indicates that the most likely location of the disease gene is between marker loci D6S251 and D6S468, an interval estimated to be approximately 28 cM. This chromosomal region overlaps with that which has been assigned previously to NCMD.20
GRIK2 “TAA” is a trinucleotide repeat polymorphism detected in the 3′ untranslated region of the kainate selective GluR6 receptor gene (GRIK2).38 GRIK2 has been localised to the region 6q16.3-q21.39 Since the two marker loci, D6S468 and D6S283, map in the same chromosomal interval40 and this kainate selective glutamate receptor is expressed in the retina,41 we decided to use this marker locus to test for linkage of GRIK2 to the disease gene in this family. We obtained a lod score of 4.82 (q =0.05) with GRIK2 “TAA” (Table 2). Thus, although clearly genetically linked to the NCMD locus, linkage analysis indicates that GRIK2 is unlikely to be the disease-causing gene due to the presence of a crossover between the trinucleotide repeat and the disease gene. Since this crossover event has occurred in the affected individual III-8 (Fig 1), the GRIK2 gene appears to be situated telomeric to the MCDR1 locus.
Discussion
Although there is anecdotal evidence that the family presented here has its origin in Ireland there is no direct link to the founders of the North Carolina pedigree who emigrated from Ireland in the 18th century. This is the case for other families in France and middle America recently linked to the MCDR1 region.21 23 25 The phenotype in our family corresponds well with that previously described with respect to the fundus appearance, symmetry of disease, and lack of progression in most cases.14-18
The normal electroretinogram, and only slight reduction in the EOG in three patients also conforms with a previous report.15 The PERG was reduced in three patients with grade III lesions only (IV1, V2, V3). The normal ERG shows that the overall function of the retina in NCMD is normal, and that deficit is restricted to the central retina. Psychophysical testing supports this view. In this respect NCMD differs from many other disorders affecting the macula in which there is evidence of diffuse involvement of retinal structures outside the macula.42-45 The only changes outside the macula are the drusen-like deposits that are restricted to the retinal periphery and appear not to cause functional loss.
The most striking feature is the retention of good visual acuity despite loss of central retina, an observation made previously. With fixation at 5° of eccentricity on the edge of the lesion a visual acuity of 6/9 was recorded, a level that normally can be achieved only within the central 1°.36 It is conceivable that the early loss of the fovea is followed by neural specialisation of an eccentric point. A grade III lesion has been previously identified in a 3 month old boy.17 The fact that visual acuity is worse in the partner eye with a similar lesion suggests that fixation is predominantly taken over by one eye, while the partner eye is neglected and does not develop an eccentric vision of similar quality.
We have localised the disease gene in this family to within a 28 cM interval between D6S251 and D6S468, a region that overlaps that assigned previously to NCMD.20 In addition, we have excluded the kainate selective GluR6 receptor gene, GRIK2 as a candidate for MCDR1. Recently, we have localised another inherited eye disorder, progressive bifocal chorioretinal atrophy, to the same chromosomal region.4 Further haplotype analysis with more marker loci is under way to refine the localisation of the NCMD gene in this family. Such a refinement may also help to determine whether or not NCMD and progressive bifocal chorioretinal atrophy are likely to share the same genetic basis.
Acknowledgments
We thank the Human Genome Mapping Resources Centre for the provision of oligonucleotide primers. This work was supported by the Medical Research Council, London (Grant No G9301094) and the Wellcome Trust (Grant No 041905). We thank A Halfyard for help with Figure 2G and C Jubb for technical assistance. MBR was supported by Deutsche Forschungsgemeinschaft and the German RP Society (DRPV).