Article Text

Abstract
Aim: To perform a preliminary assessment of the relation between optic nerve circulatory parameters and glaucomatous visual field progression.
Methods: This study included 29 eyes of 23 patients with open angle glaucoma that had typical glaucomatous nerve fibre bundle visual field defects and increased cup to disc ratios. Laser Doppler flowmetry (Oculix) was used to measure relative optic nerve blood volume (Vol), velocity (Vel) and flow in the superior temporal (ST) and inferior temporal (IT) neuroretinal rim of the optic nerve. After blood flow measurements patients were followed for 6–62 months (mean 33 (SD 17) months) and 2–11 Humphrey visual fields (4.7 (2.6) fields) were obtained. Progression of glaucoma was assessed by the slope of the corrected pattern standard deviation (CPSD) values versus time, which was calculated manually for each eye using regression analysis.
Results: A significant negative correlation was observed between Vol in the IT rim and the CPSD slope (r = −0.56, p = 0.002); patients with lower Vol tended to show faster progression of glaucomatous field damage than those with higher Vol. When the eyes were arbitrarily divided into two groups according to lower Vol (0.32 (0.06) arbitrary units, AU, n = 15) or higher Vol (0.49 (0.06) AU, n = 14), those with lower Vol had significantly worse mean CPSD slopes (0.50 (0.48) dB/year) than those with higher Vol (−0.67 (1.38) dB/year; Student’s t test, p = 0.009).
Conclusions: In the IT rim, the area most prone to develop glaucomatous field damage, lower Vol is associated with subsequently faster CPSD progression. These measurements suggest that circulatory abnormalities may have a role in the development of glaucoma.
- optic flow
- optic disc
- blood supply
- glaucomatous progression
Statistics from Altmetric.com
Numerous techniques have shown vascular abnormalities in the glaucomatous eye. Our laboratory has reported a significant decrease in the mean optic nerve blood flow in primary open angle glaucoma patients when compared to healthy control subjects.1 In addition, a significant correlation was also observed between lower blood flow and more advanced glaucomatous visual field defects.1 Michelson et al2 and Nicolela et al,3 using the scanning laser Doppler flowmetry technique, have described decreases in relative blood flow in the optic nerve head neuroretinal rim tissue and lamina cribrosa of patients with glaucoma.
A study by Findl and associates4 using scanning laser Doppler flowmetry illustrated a decrease in flow to the neuroretinal rim and cup in open angle glaucoma patients. In the same study, laser interferometry was used to show significantly decreased fundus pulsation amplitude in the cup and macula in open angle glaucoma patients compared to healthy controls.
In addition, confocal tomographic angiography, which combines confocal laser scanning ophthalmoscopy and indocyanine green angiography, has been used to demonstrate a correlation between vascular filling defects and abnormalities on Goldmann and Humphrey 24-2 visual fields.5 Furthermore, altered retrobulbar circulatory parameters have been demonstrated in glaucoma patients using colour Doppler imaging.6–8
Other studies have looked at the association between altered ocular circulatory parameters and visual field damage. Eyes with normal tension glaucoma and progressive visual field defects have been reported to have significantly lower blood flow velocities and a higher resistive index in the short posterior ciliary and retinal arteries than eyes with relatively stable visual fields.6 Using colour Doppler techniques, Schumann and associates9 found interocular differences in the ophthalmic and central retinal artery circulation in glaucoma patients with interocular asymmetry in glaucomatous progression. These studies suggest that an alteration in circulatory parameters of glaucoma patients may be associated with glaucomatous visual field damage. More recently, Piltz et al10 have reported that open angle glaucoma suspects without manifest visual field defects have decreased blood flow similar to that seen in glaucoma patients with visual field defects. This suggests that circulatory abnormalities are present early in the glaucomatous process and do not develop solely as a result of damage to the optic nerve.10
In the current investigation we assessed whether decreased optic nerve circulatory parameters are associated with visual field progression in glaucoma patients. For this purpose, we retrospectively evaluated patients in whom we had measured optic nerve blood flow using laser Doppler flowmetry and we examined serial visual fields that were obtained after the blood flow measurements.
METHODS
This study included 29 eyes of 23 patients with open angle glaucoma (13 normal tension glaucoma eyes and 16 high tension glaucoma eyes) with ages ranging from 36 to 81 years. Eleven patients had a diagnosis of systemic hypertension. Six were taking diuretics, three were on β blockers, four were on calcium channel blockers, three were on angiotensin converting enzyme (ACE) inhibitors, and one was on α blockers. Thirteen were female and 10 were male subjects. All patients had typical glaucomatous nerve fibre bundle visual field defects (such as arcuate, paracentral, and nasal step defects) and increased cup to disc (C/D) ratios with localised or generalised thinning of the neuroretinal rim (Table 1).
Baseline patient characteristics
No patients had a C/D ratio greater than 0.9. All patients were referred and diagnosed by a glaucoma specialist (JRP-S) and had previous experience with Humphrey visual field testing before optic nerve blood flow measurements were performed. Twenty five eyes were receiving topical glaucoma therapy, one patient was using an oral carbonic anhydrase inhibitor, and three patients were on no glaucoma medication (Table 2).
Ocular hypotensive therapy
Optic nerve circulatory measurements were conducted using the laser Doppler flowmetry instrument (Oculix) developed by Charles Riva, PhD, and Benno Petrig, PhD, who have applied the technique to the study of the optic nerve circulation.11 Laser Doppler flowmetry was used to measure relative optic nerve blood volume (Vol), velocity (Vel), and flow in two regions of the optic nerve: the superior temporal (ST) and inferior temporal (IT) neuroretinal rim. Determinations of Vol, Vel, and flow are shown in arbitrary units (AU).
After blood flow measurements, patients were followed for periods ranging from 6 to 62 months (mean 33 (SD 17) months). During this follow up period, 2–11 automated visual field tests (mean 4.7 (2.6) fields) were obtained for the regular clinical care of patients. Visual fields were performed using the Humphrey visual field instrument (program 24-2 or 30-2; Humphrey Instruments, San Leandro, CA, USA) and a full threshold strategy. For each eye, the corrected pattern standard deviation (CPSD) for each visual field was plotted against time. Regression analysis was used to determine the slope of the CPSD changes over time (Fig 1). The CPSD slopes are shown in decibel/year (dB/year) units. The CPSD slope was chosen to represent glaucomatous progression because it is a valuable marker for the irregularity of the contour of the hill of vision that cannot be attributed to spontaneous fluctuation.12
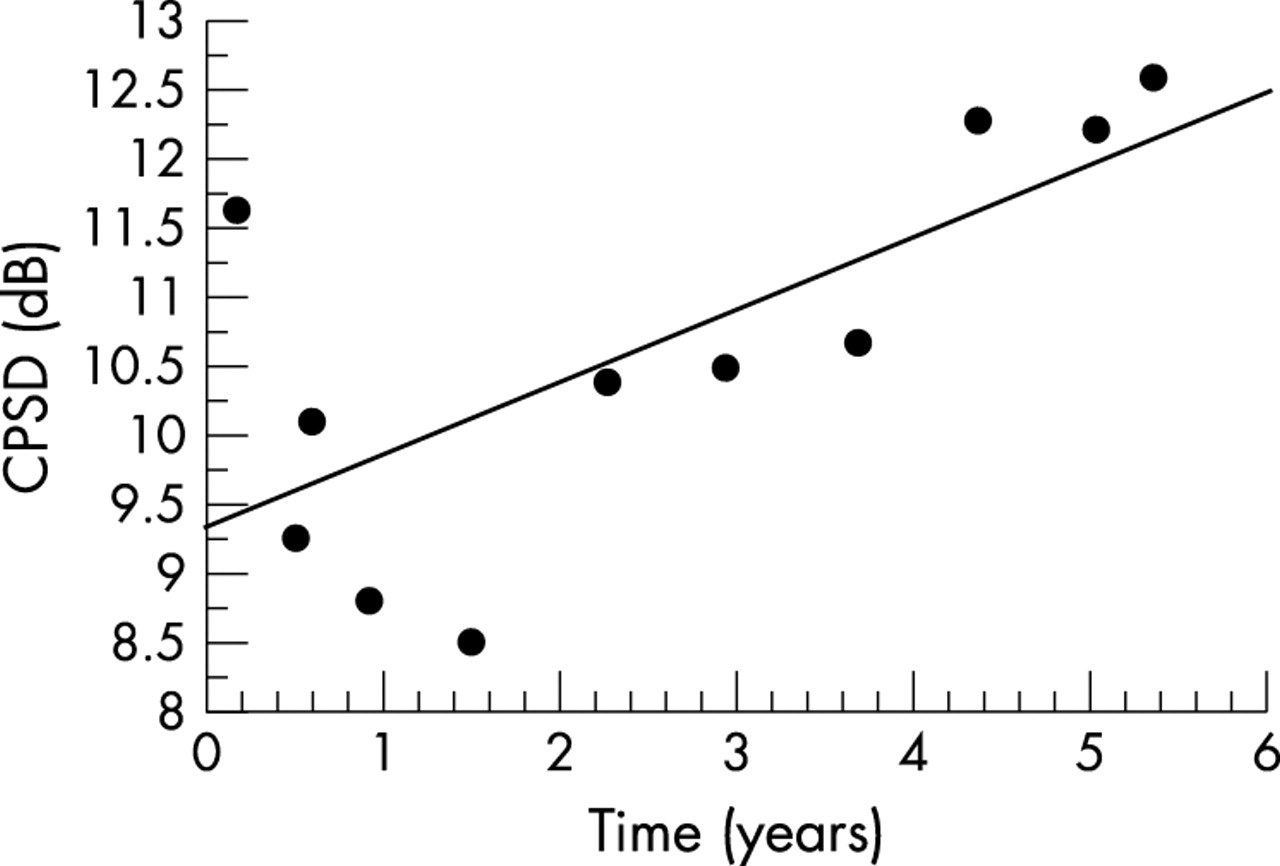
Sample regression analysis of corrected pattern standard deviation (CPSD) (dB) versus time (years) plot for a patient with worsening glaucomatous damage. There is a significant positive correlation (r = 0.71, p = 0.02; CPSD = 9.32+0.52 time).
All patients participating in the study were given a detailed explanation of the procedures and an appropriate consent form, approved by our institution, was obtained. The study conformed to the tenets of the Declaration of Helsinki. Before the measurements, the subjects’ pupils were dilated with tropicamide 1% (Alcon, Fort Worth, TX, USA) and phenylephrine hydrochloride 10% (Sanofi Winthrop, New York, New York). Polaroid fundus photographs (Polaroid Corporation, Cambridge, MA, USA) of the optic nerve head were taken before blood flow measurements to document the measurement sites. Laser Doppler flowmetry measurements were obtained using a diode laser beam (670 nm) with a 20 mW intensity and approximately 200 μm diameter delivered through a fundus camera (model TRC; Topcon, Tokyo, Japan). Determinations of Vel, Vol, and flow were obtained by focusing the laser beam on the superotemporal (ST) and inferotemporal (IT) neuroretinal rim. Measurements were done on pink neuroretinal rim, taking care to avoid visible blood vessels or atrophic and notched portions of the neuroretinal rim. The proper location of each measurement site was ascertained by direct observation of the optic nerve through the fundus camera. Measurements were conducted with patients seated in a dark room and the location of measurements was documented with fundus photography.
For each measurement site, a continuous tracing of circulatory variables was obtained for approximately 30 seconds. Data were analysed by a masked investigator using a NeXT computer with software developed by Benno Petrig, PhD.11,13 Stable circulatory variables of approximately 2–3 seconds in length were chosen for analysis. We chose those parts of the tracings with stable circulatory variables and no large fluctuations in the signal which are typical of eye blinks and eye motion. Reproducibility of the optic nerve measurements of the superior temporal rim was estimated in eight eyes from three separate measurements obtained on the same day. Average coefficients of variation were 13.4% (4.8%) for flow, 13.7% (10.6%) for Vel, and 16.2% (8%) for Vol.
Brachial artery systolic blood pressure (BPs) and diastolic blood pressure (BPd) were obtained by sphygmomanometry following blood flow measurements. The mean brachial artery pressure (BPm) was calculated according to the following formula: BPm = BPd+⅓ (BPs − BPd). Perfusion pressure (PP) for the eye was approximated using the formula, PP = ⅔BPm – IOP. The intraocular pressure (IOP) was determined using applanation tonometry following blood flow measurements.
Correlations were calculated between the CPSD slope values and Vol, Vel, and flow values obtained in the ST and IT neuroretinal rim. Circulatory measurements were also correlated with blood pressure because of previously reported evidence suggesting that blood pressure affects optic nerve head circulation in glaucoma patients.14 Following circulatory measurements, patients were arbitrarily divided into two groups according to lower and higher IT Vol. The mean CPSD slopes were compared in these two groups of eyes with a Student’s t test. An F test was used to evaluate whether there was a statistical difference in the variance between the lower and higher IT Vol groups. p Values of 0.05 were considered as statistically significant.
RESULTS
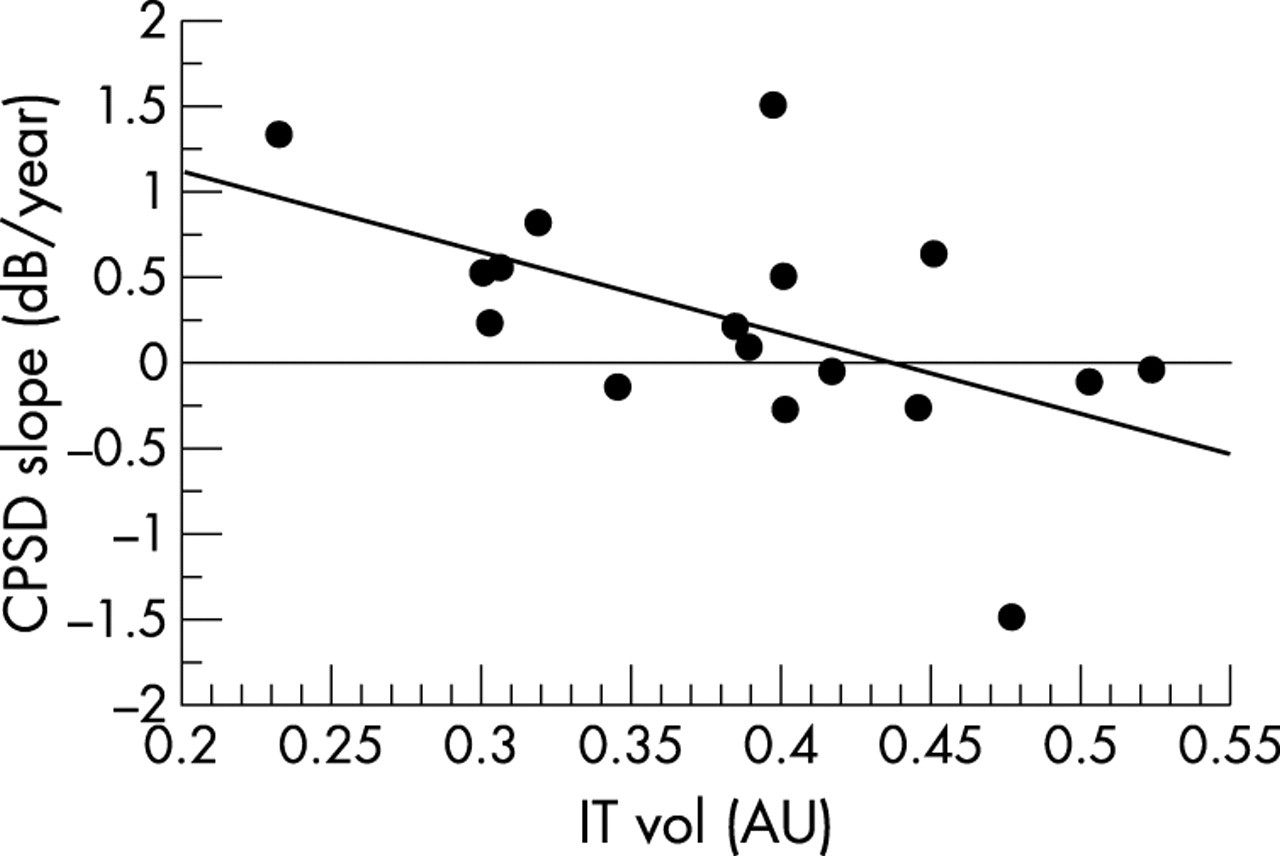
A statistically significant negative correlation was detected between the inferior temporal neuroretinal rim (IT) optic nerve blood volume (Vol) and CPSD slope (r = −0.56, p = 0.002; Fig 2). Patients with lower IT Vol tended to have more positive slopes which is consistent with more marked visual field progression. A statistically significant negative correlation between CPSD slope and IT Vol (r = −0.55, p = 0.02; Fig 3) was still present when the analysis was performed only in eyes having four or more visual fields.

CPSD slope (dB/year) versus IT Vol (AU) for all glaucomatous eyes using all visual fields obtained following laser Doppler flowmetry measurements. There is a significant negative correlation (r = −0.56, p = 0.002; CPSD slope = 2.49 – 6.37 IT Vol).

CPSD slope (dB/year) versus IT Vol (AU) for glaucomatous eyes with four or more visual fields obtained following laser Doppler flowmetry measurements. There is a significant negative correlation (r = −0.55, p = 0.02; CPSD slope = 2.11–4.81 IT Vol).
Eyes were divided into two groups by splitting the range of volumes into two relatively equal parts according to lower Vol (0.32 (0.06) arbitrary units, AU, n = 15) or higher Vol (0.49 (0.06) AU, n = 14). Those with lower Vol had a significantly greater mean CPSD slope (0.50 (0.48) dB/year) than those with higher Vol (−0.67 (1.38) dB/year; Student’s t test, p = 0.009). In other words eyes with lower IT Vol at baseline had a significantly faster subsequent progression of glaucomatous visual field defects than those with higher IT Vol. Initial CPSD at the time of blood flow measurements, however, was almost identical in eyes with lower IT Vol and those with higher IT Vol (Table 3).
Baseline patient characteristics for low and high IT Vol
The only statistically significant difference between the two groups was the mean systolic blood pressure (BPs), which was lower in the low IT Vol group (135 (12) mm Hg) than in the higher IT Vol group (147 (16) mm Hg; p = 0.02, Student’s t test).
No significant correlation was detected between the inferior temporal (IT) optic nerve blood velocity (Vel) and CPSD slope (r = 0.28, p = 0.14) or between the IT optic nerve blood flow and CPSD slope (r = −0.26, p = 0.18). Similarly, there were no statistically significant correlations between CPSD slope and superior temporal (ST) circulatory measurements.
A statistically significant positive correlation was observed between IT Vol and mean blood pressure (r = 0.41, p = 0.03; Fig 4). In addition, a significant positive correlation was also detected between IT flow and mean blood pressure (r = 0.52, p = 0.004; Fig 5). No significant correlation was detected, however, between mean blood pressure at the time of laser Doppler measurements and CPSD slope (r = −0.08, p>0.05).

Correlation between IT Vol (AU) and mean blood pressure (mm Hg) at the time of laser Doppler flowmetry measurements for all glaucomatous eyes. There is a significant positive correlation (r = 0.41, p = 0.03; IT Vol = 0.15+0.004 mean blood pressure).

Correlation between IT flow (AU) and mean blood pressure (mm Hg) at the time of laser Doppler flowmetry measurements for all glaucomatous eyes. There is a significant positive correlation (r = 0.52, p = 0.004; IT flow = −4.362+0.173 mean BP).
There was no statistically significant difference between the mean CPSD slope of patients with normal tension glaucoma (−0.13 (1.53) dB/year, n = 13) and the mean CPSD slope of patients with high tension glaucoma (−0.01 (0.81) dB/year, n = 16; Student’s t test, p = 0.66). Mean initial CPSD in patients with normal tension glaucoma (7.99 (2.88) dB, n = 13) was also not statistically different from that observed in patients with high tension glaucoma (6.59 (4.69) dB, n = 16; Student’s t test, p = 0.35).
The mean CPSD slope of patients with systemic hypertension (−0.28 (1.53) dB/year, n = 16) was not significantly different from the mean CPSD slope of non-hypertensive patients (0.21 (0.30) dB/Year, n = 13; Student’s t test, p = 0.23). Mean initial CPSD value of patients with systemic hypertension (6.21 (3.38) dB, n = 16) was not significantly different from that of non-hypertensive patients (8.47 (4.43) dB, n = 13; Student t test, p = 0.32).
DISCUSSION
The correlation observed in our study between lower inferior temporal (IT) optic nerve blood volume (Vol) and more marked progression of glaucomatous visual field damage suggests an association between altered optic nerve circulation and the progression of glaucoma. Although we cannot infer a cause and effect from this correlation, these results raise the intriguing possibility that low IT Vol may help identify patients at risk of glaucomatous progression. Identifying patients who have a higher risk of visual field loss progression could help clinicians reach better informed treatment decisions and, therefore, would be important in the clinical management of glaucoma patients.
Results of the Normal Tension Treatment Study15 associated female sex, migraine, and disc haemorrhage with increased risk ratio for progression of normal tension glaucoma. In addition to identifying qualitative vascular risk factors, it would also be useful to have a more quantitative method of discriminating patients at increased risk of developing glaucomatous progression. Measurements of optic nerve circulatory parameters could potentially offer information on risk for future glaucomatous progression.
Volume measurements obtained with the laser Doppler flowmetry technique represent the relative volume of blood present in the tissue measured and are proportional to the number of red blood cells. These measurements are probably related to the number of capillaries present in the tissue measured and the diameter of the small vessels. Therefore, eyes with lower inferior temporal optic nerve blood volume measurements probably had lower numbers of erythrocytes or capillaries, and smaller microvascular capillary diameters within the nerve tissue measured.
It is of interest that we found a significant association in the inferior temporal rim of the optic nerve, the area of the nerve most prone to develop glaucomatous visual field damage.16
Although we did not find a statistically significant association for measurements obtained in the superior temporal rim, this does not mean necessarily that such a correlation does not exist. Similarly, we also did not find a significant correlation between optic nerve velocity or flow measurements and the CPSD slope. Possibly, a larger sample size could uncover additional relations between these parameters.
Because laser Doppler flowmetry measurements of the optic nerve head circulation depend on the scattering properties of the nerve tissue, there is some controversy regarding the ability of this technique to accurately determine circulatory measurements in the glaucomatous optic nerve. This is more important when measurements obtained in a glaucomatous optic nerve are compared with those obtained in a normal nerve with minimal loss of ganglion cell axons. The results of the present study are probably less affected by these concerns because we have correlated circulatory measurements with visual field data, and have not compared circulatory data in the glaucomatous optic nerve head with that of the normal nerve. In addition, the significant correlation observed between IT Vol or IT flow and mean blood pressure support our contention that our measurements reflect the circulatory characteristics of the optic nerve.
There is also controversy in the literature about the depth of the circulatory measurements within the optic nerve head.17–20 Estimations of sampling depth in the optic nerve head with the technique used in our study have shown that laser Doppler flowmetry can penetrate as deep as the lamina cribrosa.17 Furthermore, Petrig et al have suggested that laser Doppler flowmetry measurements in the monkey optic nerve head probably originate from both the superficial and deeper layers of the nerve head, and that the exact contributions of both areas are not known.
Wang et al,20 using the scanning laser Doppler flowmetry technique, reported that the measurements originate from the more superficial layers of the nerve head. The scanning laser Doppler instrument, however, has a confocal optical configuration that probably limits the depth of the measurements, while our technique does not have such a configuration. Although our technique receives most of its signals from the superficial nerve, signals from the deeper layers also contribute to the measurements.
Regardless of the exact optic nerve depth from which our data originate, our preliminary results suggest that within our group of glaucoma patients, eyes with lower IT Vol have a significantly faster progression of glaucoma than eyes with higher IT Vol.
It is important to ascertain, however, whether there are confounding variables that could result in this type of association. A comparison of the initial characteristics of patients with low and high IT Vol did not show any significant differences between the two groups in the distributions of age, sex, history of systemic hypertension, stage of glaucoma (measured by initial CPSD and C/D ratio), type of glaucoma (high versus normal tension), or IOP (Table 3).
Our finding of a lower mean systolic blood pressure in the lower IT Vol group is not surprising since there was a direct correlation between blood pressure and IT Vol. The fact that we did not find a significant correlation between mean blood pressure and CPSD slope suggests that blood pressure may not have a large effect on our finding of a negative correlation between IT Vol and CPSD slope.
Patients with systemic hypertension were included in the study because of the high prevalence of this disease in the study population. We did not detect any statistically significant differences in initial mean CPSD and mean CPSD slope between patients with or without a history of systemic hypertension or between patients with normal or high tension glaucoma.
There are some weaknesses in the design of this study that need to be addressed. Firstly, the sample size is relatively small and in some patients both eyes were included. In addition, because this is a retrospective study, patients were followed for varying lengths of time and the number of visual fields obtained for each eye varied considerably. In five eyes only two visual fields and in seven eyes only three visual fields were available to calculate the CPSD slope. Since the slope obtained from such a small number of fields may not reliably estimate the real clinical progression, we performed a secondary analysis that excluded such eyes. This analysis, which included 17 eyes that had at least four visual fields, corroborated our results showing a significant correlation between IT Vol and the CPSD slope (r = −0.55, p = 0.02; Fig 3).
Most patients included in our study were on topical glaucoma therapy at the time that laser Doppler measurements were conducted. There is conflicting evidence in the literature about whether topical glaucoma therapy alters ocular haemodynamics. Some studies have shown that topical medication may alter ocular haemodynamics,21–24 while others have not.2,4,25
Michelson and associates2 showed that juxtapapillary blood flow is not significantly altered in glaucomatous eyes receiving topical therapy compared to untreated glaucoma controls. Findl and associates,4 using scanning laser Doppler flowmetry, also found no statistically significant difference in flow measurements obtained in open angle glaucoma patients receiving different types of topical antiglaucoma therapy. Grunwald et al25 in a study of retinal blood flow autoregulation in glaucomatous eyes also did not find large differences between patients on different topical glaucoma medications.
Because glaucoma patients in the present study were being treated with a heterogeneous variety of topical glaucoma medications it is unlikely that medications may have altered the data in a systematic way.
Furthermore, we did not find any statistically significant differences for mean IT Vol measurements in eyes receiving different topical ocular hypotensive therapies. However, the number of patients receiving the different medications was small and, therefore, we cannot reach any strong conclusions as to the effect of medications on IT Vol.
In conclusion, this preliminary study demonstrates a significant negative correlation between the IT Vol and the progression of glaucoma as measured by the CPSD slope. In addition, eyes with lower IT Vol had significantly faster glaucomatous visual field progression when compared to those with higher IT Vol. These results suggest that circulatory parameters may have potential for identifying glaucoma patients at risk for future glaucomatous visual field progression. Further studies are needed to better characterise the association between optic nerve circulatory parameters and glaucomatous visual field progression.
Acknowledgments
Grant/financial support: NIH grant EY11479, the Vivian S Lasko Research Fund and Research to Prevent Blindness.
REFERENCES
Footnotes
-
Commercial relationships: None.