Article Text

Abstract
Aim: To evaluate the interobserver variability and retest reproducibility of confocal scanning laser Doppler flowmeter in measuring capillary perfusion of the peripapillary retina.
Methods: Blood flow measurements were performed in one eye of 10 normal subjects by two investigators on two different days (visits). Five separate measurements of the peripapillary blood flow parameters were recorded by each observer at each visit. The Heidelberg retina flowmeter was used to record capillary perfusion in a 2560×640 μm area of the superotemporal peripapillary region and pixel by pixel analysis was done from an area adjacent to the optic disc, with a minimum of 1600 pixels. The percentage of pixels with less than 1 arbitrary unit of flow (no flow) and 10, 25, 50, 75, 90th percentiles of flow values was calculated. Interobserver measurements were compared by paired t test. Intraclass correlations (ICC) were used to determine the interobserver variability and retest reproducibility of the measurements. Intrasession coefficients of variations (CV) were also calculated.
Results: There were no statistically significant differences between the two observers for all measurements and between visits for the percentage of pixels with no flow. ICC was 66% (range 57.09%–77.1%) for pixels with no flow. For the 10, 25, 50, 75, 90th percentiles of flow the ICC was 63.07% (53.91%–77.81%), 71.3% (64.23%–80.85%), 72.61% (66.02%–78.96%), 65.86% (58.53%–74.77%), and 60.05% (54.34%–70.06%), respectively. CV was 16.59%, 11.47%, 9.32%, 9.03%, 11.58%, and 16.05% for the percentage of no flow pixels and the 10, 25, 50, 75, 90th percentiles of flow, respectively.
Conclusions: The Heidelberg retinal flowmeter allows reproducible measurements of all levels of capillary perfusion areas when pixel by pixel analysis is used.
- blood flow
- Heidelberg retina flowmeter
- glaucoma
- laser Doppler flowmetry
- neuroretinal rim
Statistics from Altmetric.com
Measurement of haemodynamics in ocular tissues requires accurate quantification of ocular blood flow and is of major interest in diseases in which the blood supply to the tissue may be compromised. An established method of blood flow assessment in the eye is the use of confocal scanning laser Doppler flowmetry with the Heidelberg retina flowmeter (HRF, Heidelberg Engineering, Heidelberg, Germany). This is a non-invasive technique, which allows blood flow measurement in specific retinal areas. The reliability of the HRF in vitro and in vivo has been previously described.1–5 The conventional method of HRF analysis provides the mean values of velocity, volume, and flow measurements from a software standard 10×10 pixel box. HRF flow, velocity, and volume measurements, however, are not normally distributed. Therefore, the mean is the incorrect statistic to use to describe the dataset.6,7 Using pixel by pixel analysis, however, histograms of the flow values in each pixel within the area of measurements can be plotted. This approach does not require the dataset to be normally distributed. Consequently, a detailed study of the retinal microcirculation can be performed.7 This study aims to determine the test-retest and interobserver reproducibility using the enhanced pixel by pixel analysis from flowmetry maps, measuring blood flow from the peripapillary retinal area.
METHODS
Ten eyes of 10 healthy volunteers (nine female, one male) were included in the study. Two experienced observers (FT and LM) measured the same eye on the first day and exactly at the same time on the second day. Inclusion criteria consisted of normal eye examinations with best corrected visual acuity 20/30 or better, intraocular pressure (IOP) below 21 mm Hg, no use of systemic medications with no intake of drugs influencing haemorheology 10 days preceding the examination, refractive error between −2.00 and +2.00 dioptres, and astigmatism less than 1.50 dioptres cylinder. All procedures conformed to the tenets of the Declaration of Helsinki, and were reviewed and approved by an institutional review board, and subjects provided informed consent.
The HRF is a confocal scanning laser Doppler flowmeter with a set focal plane thickness; consequently results can be influenced by focusing errors. Like in previous studies, we used Heidelberg retina tomography (HRT, Heidelberg Engineering GmbH, Heidelberg, Germany) measurements for proper morphometric adjustment and focus correction on the peripapillary retinal plane before performing HRF measurements.8 On the subject’s first visit three measurements were taken following the quality control indications given by the HRT software. HRT focus values were determined based on the HRT’s image quality feedback feature, and used during HRF imaging.
Confocal scanning laser Doppler flowmetry with the HRF was performed on one eye in each subject to measure capillary blood flow in the peripapillary retina. The measurement region was completely free of peripapillary atrophy or pigment irregularities in each case. Each eye was measured by two different investigators on two different visits, using the same protocol. Five separate measurements of the peripapillary blood flow parameters were recorded by each observer at each visit.
The HRF, a non-invasive technique, has been previously described in detail.4,9,10 The HRF using a confocal scanning laser beam at 780 nm images a 2560×2560×400 μm volume of the retina producing a two dimensional blood flow map of 256×64 pixels on the computer monitor. Velocity, volume, and flow were parameters calculated for all pixels in a 256×64 pixel area, each pixel representing measurements of blood flow from a retinal tissue column of 10×10×400 μm. The instrument software allows calculations of the mean value of flow parameters within boxes of various sizes, the default being 10×10 pixels.
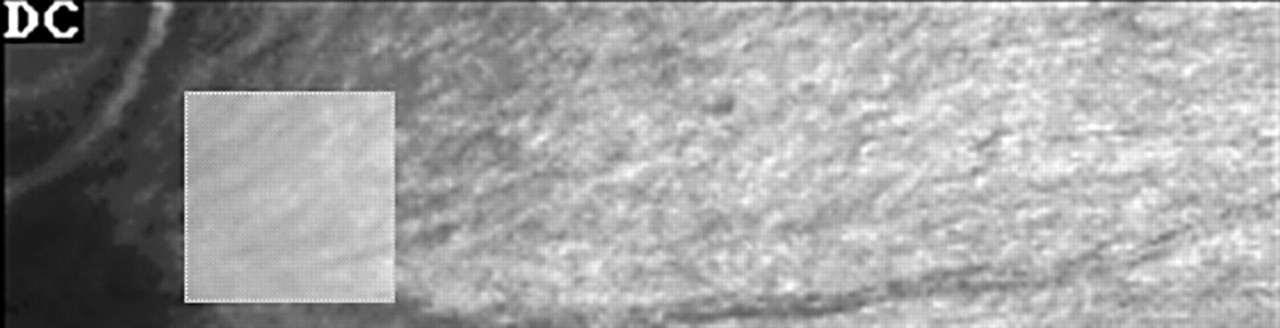
A measurement field consisting of 256×64 pixels on the computer monitor was imaged by the HRF. An area adjacent to the superotemporal part of the optic disc was selected (fig 1). Laser focus and position were optimised and sensitivity was set so that the brightest pixels within the measurement area were light yellow in colour, avoiding any white pixels.

Selection of an area adjacent to the superotemporal part of the right eye optic disc.
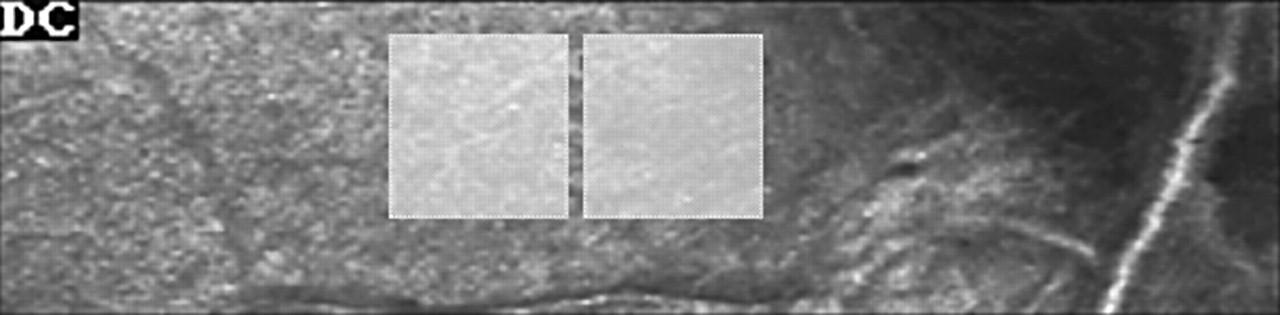
A square area of 1600 pixels (40×40 pixels) at the peripapillary retina was used for analysis with the HRF, software version 1.02 (fig 2). Large visible blood vessels were avoided, and visible capillaries analysed. If vessel configuration within the 256×64 measurement area did not allow an accurate placement of a 40×40 pixel box free from blood vessels, two 30×30 pixel or four 20×20 pixel boxes were used instead for further analysis (figs 3 and 4). Using a 1×1 pixel window, the investigator created a log file scanning the whole analysis area (fig 5). Detailed drawings following our previously described technique of morphometric area definitions of the fundus showing individual vessels and the analysis areas were superimposed on the 256×64 pixels HRF image in order to assist subsequent analysis.8

A square area of 1600 pixels (40×40 pixels) at the superotemporal peripapillary retina of the left eye is used for analysis with the HRF, software version 1.02.

Replacement of 40×40 pixel box with two 30×30 pixel boxes if vessel configuration within the 256×64 measurement area did not allow an accurate placement of a 40×40 pixel box free from blood vessels.

Left eye. Replacement of 40×40 pixel box with four 20×20 pixel boxes if vessel configuration within the 256×64 measurement area did not allow an accurate placement of a 40×40 pixel box free from blood vessels.

Right eye. Pointwise analysis (1×1 pixel window), creation of a log file scanning the whole analysis area.
Image borders and borders of the individual blood vessels including the analysis areas were used for subsequent analysis as follows. The investigator superimposed an A4 transparency on the computer monitor and using a permanent marking pen followed the perimetry of the image, the borders of the visible vessels, the optic disc borders and the analysis areas. Care was taken for the observer to be vertical to the computer monitor screen. Pixel by pixel analysis was performed superimposing the transparency drawings on the computer monitor using the disc borders and the blood vessels as landmarks.
All interobserver parameters were compared by paired Student’s t test. The mean flow value, percentage of pixels with no flow, and the 10, 25, 50, 75, 90th percentiles of flow values were calculated from the entire analysis area. Intraclass correlation (ICC) was used for statistical analysis. The coefficient of variation (CV) was also used to measure intrasession variability for each outcome.
RESULTS
There were no statistically significant differences between the two observers for all measurements and between visits for the percentage of pixels with no flow (table 1). ICC was 66% (range: 57.09%–77.1%) for pixels with no flow. For the 10, 25, 50, 75, 90 percentiles of flow the ICC was 63.07% (53.91%–77.81%), 71.3% (64.23%–80.85%), 72.61% (66.02%–78.96%), 65.86% (58.53%–74.77%), and 60.05% (54.34%–70.06%), respectively (table 2). CV was 16.59%, 11.47%, 9.32%, 9.03%, 11.58%, and 16.05% for the percentage of no flow pixels and the 10, 25, 50, 75, 90 percentiles of flow, respectively (table 3).
Differences between the two observers for all measurements and between visits for the percentage of pixels with no flow and for the 10, 25, 50, 75, 90th percentiles of flow
Intraclass correlations (ICC) for pixels with no flow and for the 10, 25, 50, 75, 90th percentiles of flow in all subjects
Coefficient of variation (CV) for the percentage of no flow pixels and the 10, 25, 50, 75, 90th percentiles of flow in all subjects
DISCUSSION
The HRF allows non-invasive evaluation of retinal and optic nerve capillary blood flow providing quantitative high definition two dimensional maps of the blood volume, blood velocity, and volumetric blood flow. With the default method of data analysis, using the 10×10 pixel box, reproducible measurements of the mean values of velocity, volume, and flow in the peripapillary retina can be acquired. Previous studies described coefficients of reproducibility between 0.7 and 0.95 for flow measurements using the standard measurement window.1–5 There is a higher reproducibility in short term comparisons than in long term studies, the last providing higher variability of flow results. Long term reproducibility may be increased by increasing the number of pixels included in the analysis.11
One study found high reproducibility of repeated interobserver measurements of the retina with the default measurement window of 10×10 pixels5 and described CVs from consecutive intraindividual measurements ranging from 3.43% to 71.04%, depending on measurement location and measurement window size. Certainly, there are various factors influencing blood flow measurements. Apart from individual vascular anatomy and related perfusion differences, there are camera distance to the eye, angle of image acquisition, brightness and sensitivity settings related disturbances.10–12 An important factor affecting blood flow measurements with HRF is location dependence. Although the 10×10 pixels measurement has been described as optimal in reproducible measurements of optic nerve head blood flow,13 the small default measurement frame provides localised results and small location changes may lead to important differences in values. The 10×10 box only contains, on average, two capillaries. This could explain the large variation that occurs when the box is moved.11 It is probable that a different box placement will contain different capillaries.
The conventional way of analysis does not give an indication of the distribution of the flow values within the 10×10 analysis window. Moreover, areas of low capillary perfusion within the measurement area cannot be identified. In this study, using pixel by pixel analysis from an area 16 times larger than the 10×10 default pixel window, histograms of the flow parameters were plotted. When HRF data are displayed in a histogram, it is evident that the data are not normally distributed. The central limit theorem requires data described by a mean to be normally distributed; therefore any process that would average HRF data introduces error into the measurements.
There was good interobserver agreement for all the parameters measured. No statistically significant difference was found between visits for the percentage of pixels with no flow and the intrasession coefficient of variation ranged from 9.03% to 16.59%.
Blood flow measurement devices are gaining an increasing importance in clinical practice for assessment of compromised blood flow within chronic ocular diseases as well as for follow up measurements. It is of particular interest that these devices deliver reliable data and that for improvements in reproducibility are required as a warrant of better measurement approaches in the future.
The purpose of this study was to determine the reproducibility of the whole process of retinal blood flow measurement from the peripapillary area which includes image acquisition and analysis. This process showed good reproducibility as well as good inter-observer and intraobserver agreement. The study was not designed to address the question of reproducibility using new software or to determine the reproducibility of the analysis process alone.
Following the results of our study, the Heidelberg retina flowmeter allows reproducible measurements of low capillary perfusion areas when pixel by pixel analysis is used.
REFERENCES
Footnotes
-
Supported in part by an unrestricted grant from Research to Prevent Blindness. New York, New York. AH is recipient of the William and Mary Greve Award from Research to Prevent Blindness.