Article Text

Abstract
Aim: To describe a new image analysis method and software for anterior chamber images obtained by the anterior-segment optical coherence tomography (AS-OCT) and to assess its intraobserver and interobserver measurement reproducibility.
Methods: Twenty 8-bit greyscale 600×300 AS-OCT images with apparent wide angles and 20 images with apparent narrow angles were consecutively selected from a database. Two glaucoma fellowship-trained ophthalmologists used proprietary image analysis software to analyse the images twice. Algorithms defined the borders and curvatures of anterior chamber (AC) structures and measured AC parameters using scleral spur location as the only observer input. The intraobserver and interobserver reproducibility of scleral spur location and angle parameters was calculated in terms of limits of agreement (LOA; mean of differences±1.96SD of differences) and coefficient of variation (CV; SD of differences/overall mean).
Results: The analysis software successfully measured all parameters in all images. When the same image was assessed twice by the same grader, the mean differences ranged from 0 to 0.010 mm in linear measurements and 0.001 to 0.006 mm2 in angle area measurements. LOA tended to be greater in the wider angles. The upper and lower limit values of LOAs were approximately 1/5 to 1/4 of the overall mean. Measurements between two graders had a higher variance. Reproducibility in terms of CV was better in wide angles when compared with narrow angles. The reproducibility of scleral spur placement between observers was poorer in narrow angles (p = 0.001). About 50% of the interobserver variance in angle-area measurements was attributable to the variance of scleral spur placement, while this proportion was only 10–20% in linear measurements.
Conclusions: Determination of angle parameters using semiautomated software leads to variability in measurement. Variability increases when more than one observer identifies the scleral spur. Variability differs in narrow and open angles, and so including both types is essential when evaluating angle-assessment software. A fully automated analysis and higher image resolution would likely improve quantification of Visante AS-OCT images.
Statistics from Altmetric.com
Anterior segment optical coherence tomography (AS-OCT), unlike gonioscopy and ultrasound biomicroscopy (UBM), is a fast, non-contact method of imaging the anterior chamber (AC).1–3 A single image reveals the entire cornea, both angles on one meridian, and the anterior portion of the lens. The ease of acquiring such a complete image makes AS-OCT suitable for quantitative measurement of the drainage angle and anterior segment.1 Although AS-OCT penetrates dense tissues less effectively than UBM, leaving the ciliary body and some angle recesses in poorer contrast, it provides a good definition of the iris surface and angle structures such as the scleral spur.3 Unfortunately, quantification of AC parameters using AS-OCT images is cumbersome. The built-in software of the Zeiss Visante AS-OCT device offers a limited amount of measurable parameters and requires time-consuming and subjective user input, which may compromise measurement reproducibility.
In the current study, we describe a newly developed algorithm and measurement methods for the anterior chamber angle. We also evaluate the reproducibility of such measurements in terms of intraobserver and interobserver agreement on selected angle parameters commonly used in angle-closure research.
METHODS
Images were collected with the Zeiss Visante AS-OCT (Carl Zeiss Meditec, Dublin, CA) by the Singapore National Eye Center. Informed consent was obtained from all participants, and the study, which adhered to the tenets of the Declaration of Helsinki, had the approval of the Singapore Eye Research Institute Review Board. The details of AS-OCT imaging technology have been described previously.4 Briefly, the image is horizontally composed of 256 A-scans in 16 mm with 1024 points per A-scan in 8 mm of depth. Each image has a maximum transverse and axial resolution of 60 μm and 18 μm respectively. Scanning at 2000 axial scans per second, the machine needs approximately an eighth of a second to scan one eye. Images were taken directly from the machine’s output function as 816×636 pixel JPEG (lossless compression) files. All selected images were temporal/nasal scans. Equal numbers of narrow and wide angle images were selected in order to increase the precision of estimates of reproducibility for each type of angle configuration. Forty images were chosen from the database by consecutively searching eyes until we had found 20 with apparent narrow angles and 20 with apparent wide angles. No specific criteria, such as visibility of scleral spur or alignment of the angel, presentation of interference flare, were used in the images selection. Observers were encouraged to estimate the location of the scleral spurs in images that presented ambiguous spur anatomy. Each image was analysed twice by each observer on two separate occasions; analyses were made at intervals of 2–3 days in order to reduce the influence of observer memory on assignment of scleral spur position. For each image observers only opened the image file and identified the two scleral spurs, the algorithm then calculated all parameters.
Image processing
The Zhongshan Angle Assessment Program (ZAAP, Guangzhou, China) software automatically extracted the 300×600 8-bit greyscale (intensities from 0 to 255) image portion of the output file and performed noise and contrast conditioning. A binary copy of the image was then produced, with pixels defined as 1s (tissue) or 0s (open space) according to a calculated brightness/darkness threshold value. Algorithms defined the borders of the corneal epithelium and endothelium, and the anterior surface of the iris. These algorithms used basic edge arguments (five consecutive 0s above five consecutive 1s indicated an anterior surface point) to describe the borders. The corneal border data were fitted with polynomic curves. To maintain the integrity of the corneal endothelium’s original contour, we avoided using the fitted curve as the border. The fitted curves were required only for derivative data and border estimation in areas of poor border contrast. A line-smoothing algorithm that was explicitly defined by the edge-finding algorithms used the derivative data to repair step-like portions of the border.
Definition of angle parameters
The angle-opening distance (AOD), as defined by Pavlin et al,5 is the length of a line drawn from the anterior iris to the corneal endothelium perpendicular to a line drawn along the trabecular meshwork at a given distance from the scleral spur. AOD was calculated at 250 μm, 500 μm and 750 μm from the scleral spur. The angle recess area (ARA) and TISA as defined by Ishikawa et al6 and Radhakrishnan et al3 respectively, are measurements of the area bordered by the anterior iris surface, corneal endothelium, and a line perpendicular to the corneal endothelium drawn to the iris surface from a point at 750 μm anterior to scleral spur. TISA further modifies this measurement by excluding the area below a line drawn from the corneal endothelium to the anterior iris perpendicular to the corneal endothelium. ARA was calculated at 750 μm, and TISA was calculated at 500 μm and 750 μm.
We used derivative data from the equations fitting the corneal endothelium to define the slope of the lines lying perpendicular to the endothelial surface. We believe this avoids the insensitivity associated with using a line perpendicular to a straight line along the entire trabecular meshwork, while still providing a consistent curvature and accurate slopes of lines normal to any tangent on that surface.
Statistical methods
Statistical analysis was performed by STATA (StataCorp LP, College Station, TX) and Analyse-it (Analyse-it Software, Leeds, UK). Paired t tests were used for the differences between repeated measurements. Limits of agreement (LOA) were defined as the mean of differences±1.96SD of differences. The coefficient of variation (CV) was defined as the SD of differences divided by the overall mean. p Values less than or equal to 0.05 were considered significant.
RESULTS
Intraobserver reproducibility
The mean of differences (bias) was generally small between two repeated measurements by the same observer. The bias ranged from 0 to 0.010 mm in linear measurements (AODs) and from 0.001 to 0.006 mm2 in angle area measurements (TISA, ARA). Limits of agreement (LOA) were similar for the two observers. As expected, since the mean values were larger, LOA tended to be wider in the measurements with higher mean values in both linear and area parameters. The upper or lower limit values were approximately 1/5 to 1/4 of the overall mean values for both wide and narrow angles. Area measurements had smaller LOAs than their linear counterparts (table 1).
Interobserver reproducibility
Interobserver LOA generally exceeded intraobserver LOA; however, LOA values in the interobserver agreement were similar to those in the intraobserver agreement (table 1).
Agreement on wide and narrow angles
The SD on repeated scleral spur placements was significantly higher in narrow angles: the SD was 1.0 pixels in wide and 3.3 pixels in narrow angles for the x coordinate on temporal angles (p = 0.001). SDs in other coordinate and quadrants were similar (table 2). Although the bias tended to be larger in the narrow angles, the average absolute biases were similar (wide: 0.9 pixels; narrow: 0.8 pixels). Interobserver CVs were greater in narrow angles for all angle parameters except TISA500 (table 3). The limits of agreement in narrow angles were narrower for all angle measurements, though this agreement difference between wide and narrow angles was not as apparent in area parameters. Linear regression of absolute distance between spur placements (√((Δx)2+(Δy)2)) by absolute difference in angle measurements suggested a positive linear association where greater slopes (correlation coefficients) were observed in wide angles in both linear and area measurements. The variation of scleral spur placements explained a large proportion of the variance of angle measurements (R2 values) and was generally greater in area parameters (table 4).
DISCUSSION
Angle width is a key measurement in angle-closure research. Accurate measurements cannot be made without accurate border identification. The first step in border identification is conditioning of the image’s noise and contrast. A program commonly used in angle quantification, UBM Pro 2000 (Paradigm Medical Industries), requires user identification of the anterior chamber and adjustment of the contrast threshold. An issue exists in images where the cornea is fainter than the noise just anterior to the iris face: if the threshold is too high (only bright pixels remain) the faint corneal endothelium is dissolved; if it is too low, the noise anterior to the iris is considered iris tissue. The image analysis we developed needs only the manual indication of the two scleral spurs. The preprocessing algorithm requires no user input and thus avoids measurement variance when only threshold is changed between otherwise identical analyses. The algorithm conditions the image by progressively tailoring contrast thresholds and noise filters until a certain pixel intensity distribution is achieved.
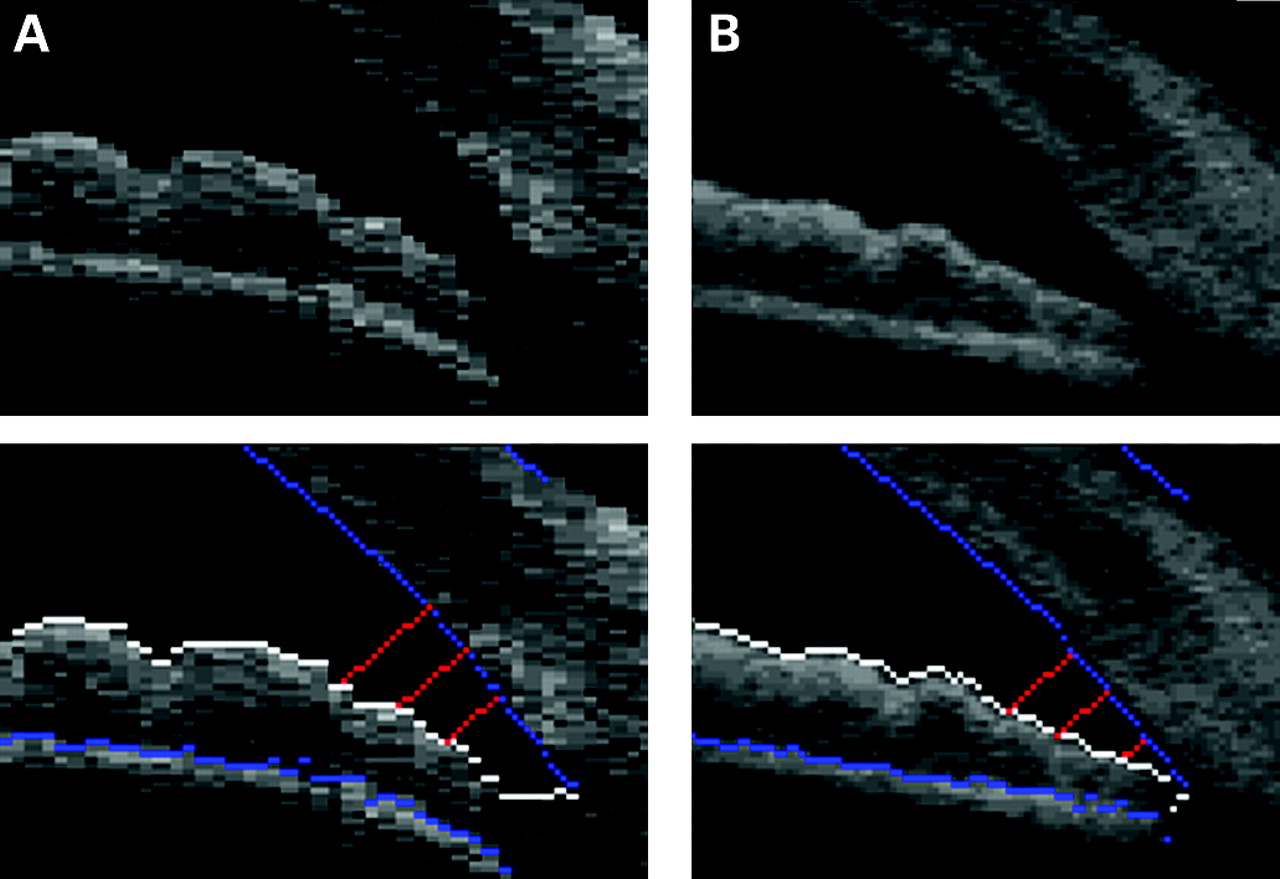
Angle-width measurements such as AOD, ARA and TISA require manual identification of the scleral spur as a measurement reference point. The drawbacks to this practice have been well documented.2 8 Not all images contain a well-defined “spur.” Different operators use different criteria to locate the spur. Even with identical location criteria, intraobserver variance in spur location can be high. These data reflect this subjective quality with interobserver variance often being higher than intraobserver variance in angle measurements. (An operator-independent measurement of angle width is a possible solution to measurement variance caused by manual spur identification. We have developed this algorithm and will describe it in a separate paper.) We believe our study to be the first to quantitatively explore the relationship between spur placement variance and resulting variance in angle measurements (table 4). Along with slightly better reproducibility, the area measurements’ insensitivity to irregular iris surfaces led to more predictable responses to changes in spur position. Wide angles generally had the most significant correlations between changes in spur placement and changes in AOD values. In narrow angles, the iris profile would be expected to appear more parallel to the corneal endothelium in the most peripheral section, and so the angle measurements would be less sensitive to the changes of scleral spur placement (although the variation of SS placement was greater in narrow angles). The smaller betas and greater R2 values of the linear regression model in narrow angles support this assumption. Despite this suggested resistance to spur placement-induced measurement differences in narrow-angle eyes, AODs continued to show relatively high variance, particularly when seen in the context of the measurement mean (CV, table 3). This could reflect the higher variance in spur placement in narrow angles (table 2) as well as AOD’s sensitivity to not just gross iris contour but fine tissue and resolution-based perturbations along the iris surface (figs 1, 2A).

Automatic measurement that does not require a subjective identification of the scleral spur will likely minimise the variance due to scleral spur placement.9 However, automatic measurement often needs to consider the angle recess as the reference point for measurements. The limited resolution and poor contrast of the angle recess area in ASOCT images may compromise accuracy: the measurements taken in eyes with very narrow angles or iridotrabecular contact can be problematic if the software identifies the apparent contact between the peripheral iris and trabecular meshwork as the reference point. Given these problems in automated measurement, semiautomatic measurement remains indispensable in studies where measurements need to be comparable and valid among all individuals.
The relatively coarse horizontal resolution in current AS-OCT images is likely a large factor in angle-measurement reproducibility. The dimension of the originally scanned image is 256×1024 (width×height) pixels. The image is then transformed to the actual scale of 600×300 pixels. During this resizing, over two-thirds of the vertical resolution is neglected, and the horizontal data must be stretched to over twice the size to represent the actual AC dimensions. This exaggerates contour differences and artefacts such as noise. While the precision of AOD measurements is limited by the dimensions of a pixel (27 μm minimum to 38 μm diagonal), the surfaces they measure span horizontally in 54 μm or 81 μm increments, leaving surfaces with step-like profiles that further hinder measurement reproducibility (fig 2A). Applying interpolation and surface smoothing algorithms would likely provide a higher precision and reproducibility, though manipulation of surface data would have questionable scientific utility. Even with operator-free angle measurement, this low resolution would likely preserve high interimage measurement variance. Fortunately, AS-OCT images will soon have an improved image quality. According to the manufacturer, an improved version of AS-OCT will average four scans to reduce noise and produce a finer horizontal resolution (personal communication, Carl Zeiss Meditec). This function was applied in the prototype device but not the commercial version.10 Our software works better using such composite prototype images where the averaging of multiple images was used (fig 2B). These improvements of the AS-OCT image will probably improve measurement reproducibility when the visibility of scleral spur and edge resolution improves. Many studies use inappropriate methods for analysing reproducibility.11 A reproducibility value is specific to the distribution of measurements in which it was calculated. In our study, we found reproducibility values to vary substantially between wide and narrow angles. The limits of agreement tightened in narrow angles, though coefficients of variation (CV) increased significantly due to the smaller means of the narrow angle measurements. These results highlight the shortcomings of using CV to compare angle-measurement reproducibility among different studies as well as the difficulty in comparing our results to those of the other studies that measured only wide angles12 13 Agreement and reproducibility results from studies that used only wide angles may not accurately represent measurement performance in narrow angles. This study is the first to our knowledge that investigates measurement reproducibility in both wide and narrow angles.
Our study was subject to limitations. AS-OCT images were natively stored as larger binary files that perhaps allow more detailed image conditioning of the original scan data. Since we had access to JPEG files only, we may have lacked the ability to better define the spur through such conditioning. A second limitation is that our liberal image-selection methodology makes it difficult to directly compare the results of our study with those of others. Lastly, we used images of Chinese eyes only, so our results may not be applicable to other populations.
In conclusion, taking methodological differences into consideration, the reproducibility in our study was comparable with that of other studies.10 12 13 Coarse resolution and variation in spur placement appeared to increase the variance of spur-dependent measurements. Our spur-placement reproducibility in narrow angles adds to the concerns about inherent variance in the manual identification of spurs. Fully automated analysis is a possible solution to this issue. Full outomation and improved resolution could make complete analysis of AS-OCT images a valuable tool for future PACG research and screening.
REFERENCES
Footnotes
-
Competing interests: DSF and TA have received instruments loaned by Zeiss-Meditec, Heidelberg Engineering, and Takagi Instruments and TA has received research assistance from Zeiss Meditec.
-
Ethics approval: Ethics approval was provided by the Institional Review Board of the Singapore Eye Research Institute.
-
Patient consent: Obtained.