Article Text

Abstract
Aim To quantify structural and functional degeneration in the retinal nerve fibre layer (RNFL) of patients with multiple sclerosis (MS) over a 2-year time period, and to analyse the effect of prior optic neuritis (ON) as well as the duration and incidence of MS relapses.
Methods 166 MS patients and 120 healthy controls underwent assessment of visual acuity and colour vision, visual field examination, optical coherence tomography, scanning laser polarimetry and visual evoked potentials (VEPs). All subjects were re-evaluated after a period of 12 and 24 months.
Results Changes in the optic nerve were detected by structural measurements but not by functional assessments. Changes registered in MS patients were greater than changes in healthy controls (p<0.05). Eyes with previous ON showed a greater reduction of parameters in the baseline evaluation, but RNFL atrophy was not significantly greater in the longitudinal study. Patients with MS relapses showed a greater reduction of RNFL thickness and VEP amplitude compared with non-relapsing cases. Patients with and without treatment showed similar measurement reduction, but the non-treated group had a significantly higher increase in Expanded Disability Status Scale (p=0.029).
Conclusions MS causes progressive axonal loss in the optic nerve, regardless of a history of ON. This ganglion cell atrophy occurs in all eyes but is more marked in MS eyes than in healthy eyes.
- GDx
- multiple sclerosis
- OCT
- optic neuritis
- relapsing-remitting multiple sclerosis, visual evoked potentials
- visual fields
- visual pathway
- electrophysiology
- degeneration
- diagnostic tests/investigation
Statistics from Altmetric.com
- GDx
- multiple sclerosis
- OCT
- optic neuritis
- relapsing-remitting multiple sclerosis, visual evoked potentials
- visual fields
- visual pathway
- electrophysiology
- degeneration
- diagnostic tests/investigation
Introduction
Loss of retinal ganglion cells can be detected by means of ocular imaging technologies such as optical coherence tomography (OCT) and scanning laser polarimetry (GDx), which provide non-invasive, objective and reproducible methods to evaluate the retinal nerve fibre layer (RNFL). Visual evoked potentials (VEPs) are also useful to evaluate the transmission information within the visual system.
Axonal loss has been detected in multiple sclerosis (MS) patients1–6 and is considered to be the main cause of disability.7 8 Several studies have reported a correlation between axonal loss observed in the optic nerve and functional disability in MS.1 2 4 However, although it is also known that an age-related RNFL loss occurs in healthy subjects9 no longitudinal study has evaluated changes in the RNFL over time, comparing the rate of axonal loss in MS patients with that of healthy subjects.
Previous authors have already reported that axonal loss in the optic nerve seems to reflect degenerative changes in the brain secondary to MS. The aim of the present study was to assess progressive damage in the RNFL over a 2-year period and identify the disease characteristics influencing this loss.
Methods
One hundred and sixty-six patients with a diagnosis of defined MS (54 men, 112 women) were enrolled in the study. Patients with optic neuritis (ON) episodes during the follow-up were excluded. The diagnosis of MS was based on standard clinical and neuroimaging criteria.10 Related medical records were reviewed, including disease duration, the Expanded Disability Status Scale (EDSS), treatments, acute MS attacks and the presence of prior episodes of ON as reported by the treating neurologist and the patient. The EDSS was scored at the time of a routine 6-month clinical visit by a neurologist with experience in MS. The patients neither had concomitant ocular diseases nor any history of retinal disease, glaucoma or significant refractive errors (more than 5 dioptres of spherical equivalent refraction or 3 dioptres of astigmatism), or systemic conditions that could affect the visual system.
One hundred and twenty healthy subjects were included in the study. They were sex- and age- matched with the MS patients. Only one randomly chosen eye from each subject was included.
All procedures adhered to the tenets of the Declaration of Helsinki, and the protocol was approved by the local ethics committee for the protection of human subjects. All subjects gave informed consent to participate in the study, and underwent a complete neuro-ophthalmological evaluation that included pupillary, anterior segment and fundoscopic examinations, assessment of best-corrected visual acuity (using the Snellen scale), colour vision (Ishihara pseudoisochromatic plates), visual field examination, OCT, GDx and VEP measurements. All subjects were tested again after a period of 12 months and again at 24 months in order to assess changes in the RNFL.
The visual field was assessed using a Humphrey Field Analyzer (Carl-Zeiss Meditec, Dublin, California, USA). A SITA Standard strategy (program 30-2) was used, with the recorded parameters being mean deviation (dB) and pattern of defect.
OCT (Cirrus HD, Carl Zeiss Meditec) tests were performed with the optic disc protocol and the 512×128 cubic volume macular protocol. The outcome measures analysed were average, superior, temporal, inferior and nasal RNFL thicknesses, macular average thickness and macular volume.
GDx (GDx VCC, Laser Diagnostic Technologies, San Diego, California, USA) was performed to obtain five parameters: nerve fibre indicator (NFI), TSNIT (temporal-superior-nasal-inferior-temporal) average, superior average, inferior average and TSNIT SD. NFI is an indicator based on the map of total RNFL thickness and high values indicate RNFL damage. It is used in glaucoma, but some authors have suggested that NFI could be useful in assessing neuro-ophthalmological conditions.11 12 Explorations with either GDx or OCT were always performed by the same explorer in a random order to prevent bias by fatigue effect.13
VEPs were recorded with a Neuronic SenseWitness 4.0 machine (Neuronic Zaragoza, Spain), in a dark room and with full correction of refraction if necessary. Electrodes were fixed with collodion in the mid-occipital and mid-frontal locations, with vertex (Cz) used as ground. Stimulation was monocular, and visual stimuli followed a checkerboard pattern (contrast, 80%; check size, 47′; mean luminance, 93 cd/m2). Patterns were reversed in contrast with a frequency of 1 Hz. The transient VEP response is characterised by a number of waves with three successive peaks of negative, positive and negative polarity. In normal subjects, these peaks have latencies of 75, 100 and 145 ms (N75, P100, N145), respectively. Latency and peak-to-peak amplitude were recorded for the P100 wave. At least two records of 100 events each were obtained and the average was calculated.
Statistical analysis
This was a longitudinal observational cohort study. All data analyses were performed using the SPSS software V.15.0 (SPSS Inc.). The Kolmogorov–Smirnov test was used to assess sample distribution. Given the parametric distribution of data, differences between evaluations of the patients and healthy controls were compared using a paired Student t test in each group. Values of p<0.05 were considered to be indicative of statistically significant differences. The changes registered in MS and healthy subjects over the study period were compared by Student t test. We used the Student t test to compare changes in the parameters of 128 patients without MS relapses during the study versus 38 patients with non-ophthalmic MS attacks.
Changes in the RNFL were also compared between patients with a prior ON episode (ON-MS) and patients with MS and no prior ON, by means of a Student t test. A similar analysis was made between the groups of patients diagnosed with MS for more than and less than 10 years.
Linear agreement between change of RNFL average thickness and changes in functional and structural parameters was sought by means of the Pearson correlation coefficient.
Regression analysis was used to identify variables that were predictors of axonal damage in MS patients.
Differences in measurement changes between patients with treatment and patients without treatment for MS were compared using a Student t test.
Results
One hundred and sixty-six eyes from 166 MS patients were examined. The mean intraocular pressure was 13.80 mm Hg (range 9–20). A previous acute ON attack was reported for 48 eyes (28.9%), while 118 eyes (71.1%) were studied from patients who had no history of ON. The duration of the MS ranged from 6 months to 40 years with a median of 9.27 years since diagnosis. The ages of patients ranged from 20 to 69 years with a mean of 41.43 years. One hundred and fifty-six patients had relapsing-remitting MS (94.0%), four had primary progressive MS (2.4%) and six had secondary progressive MS (3.6%). The mean EDSS was 2.5 (range 0–8) at the baseline evaluation and 2.51 (range 0–8.5) at the 2-year follow-up. Sixty-four (38.5%) of the patients received no specific treatment for MS, whereas the other 102 (61.5%) patients were treated with interferon β during the course of the study. Thirty-eight (22.9%) patients presented at least one MS relapse without ophthalmic symptoms during the 2-year follow-up.
All RNFL parameters were more affected in MS patients compared with healthy controls, as shown in figure 1. We found significant differences between groups in relation to structural and functional parameters examined in the evaluation carried out at the beginning of the study period. The VEP showed delayed latency and reduced amplitude in MS patients.
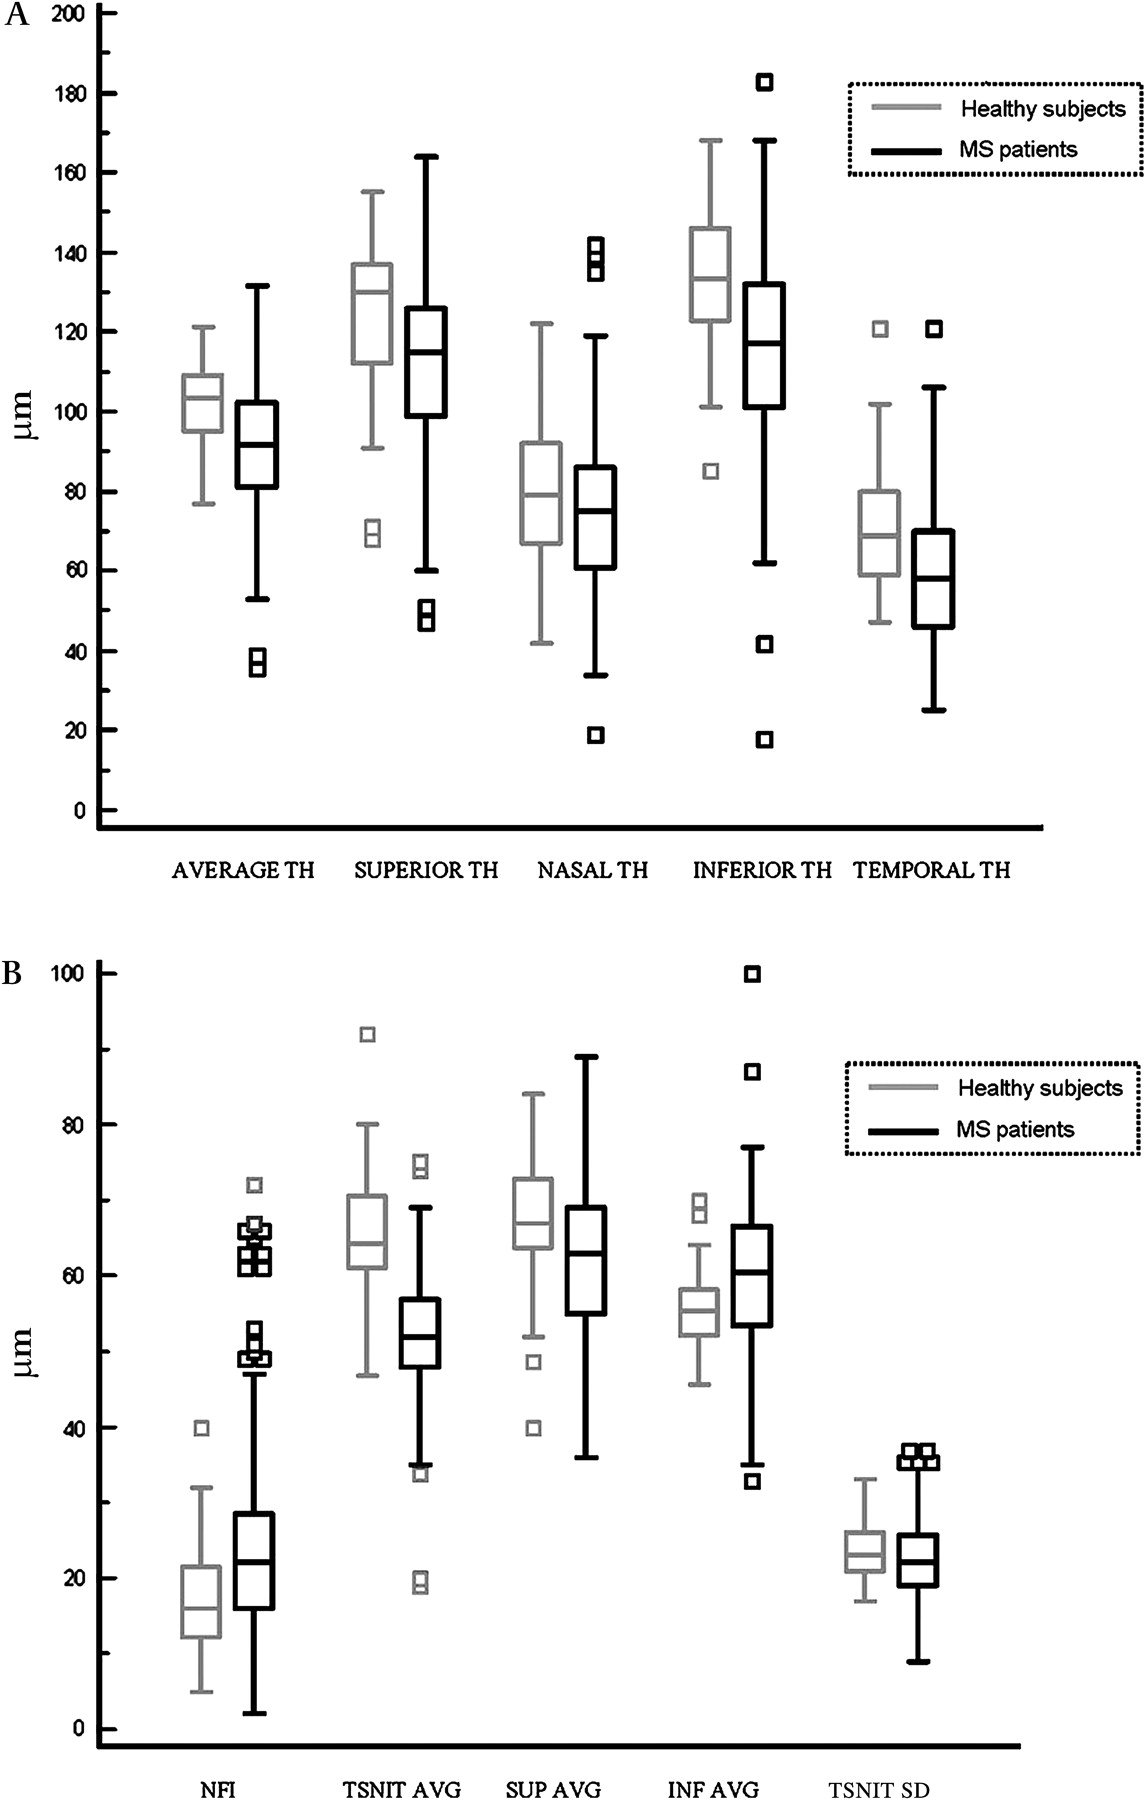
(A) Comparison of the mean retinal nerve fibre layer average and quadrant thicknesses measured using optical coherence tomography in multiple sclerosis patients and healthy controls (baseline evaluation). (B) Comparison of the mean parameters obtained using scanning laser polarimetry in multiple sclerosis patients and healthy controls (baseline evaluation). AVG, average; INF, inferior; NFI, nerve fibre indicator; SUP, superior; TH, thickness; TSNIT, temporal-superior-nasal-inferior-temporal.
Statistically significant differences between the initial baseline and biannual examinations in MS patients were observed for all RNFL thickness measurements provided by OCT and for the NFI indicator obtained by GDx, as reported in table 1. The largest decrease was found in the temporal and average OCT RNFL thicknesses (mean decreases of 10.74% and 6.21%, respectively). The largest changes with respect to GDx measurements were found in the NFI, with an increase of 7.64%, and in the TSNIT SD, which showed a decrease of 8.3%, although this was not significant. Functional parameters (VEP amplitude and latency, and mean deviation of visual field) revealed no significant differences between the baseline and 2-year examinations in MS patients.
Comparison of functional and structural measurements of MS patients and healthy subjects at the baseline evaluation and 2-year follow-up
A comparison of the changes registered during the 2-year follow-up in healthy and MS subjects showed greater decreases of RNFL thicknesses in the MS patient group for most of the parameters examined, but statistical differences were found only for the average RNFL thickness obtained using OCT. As shown in figure 2, changes in structural parameters were evident at the 1-year evaluation and increased at the 2-year examination.

Differences in the average (AVG), superior (SUP), nasal, inferior (INF) and temporal (TEMP) quadrant retinal nerve fibre layer (RNFL) thicknesses between baseline, 1- and 2-year evaluations in patients. Patients with multiple sclerosis exhibited a longitudinal decrease in the average and quadrant RNFL thicknesses. TH, thickness.
The RNFL degeneration and VEP amplitude reduction were greater in MS patients with non-ophthalmic MS relapses during the study, as shown in table 2. These patients showed higher reductions in average (−9.39 vs −4.33 μm, p=0.013) and nasal quadrant thicknesses, macular volume and TSNIT SD for GDx. NFI showed a greater increase in patients with relapses (p=0.015) and the decrease in VEP amplitude was greater in these eyes.
Changes registered during the 2-year follow-up of functional and structural parameters in MS patients with MS attacks during the study and patients without attacks
Axonal loss in the RNFL at the 1- and 2-year follow-ups was slightly greater in ON patients than in those with no such history, although these results were not statistically significant. Table 3 shows the differences in parameter changes during the study for ON and non-ON patients.
Changes registered during the 2-year study of functional and structural parameters in MS patients with a previous episode of optic neuritis (ON-MS) or without (NON-MS)
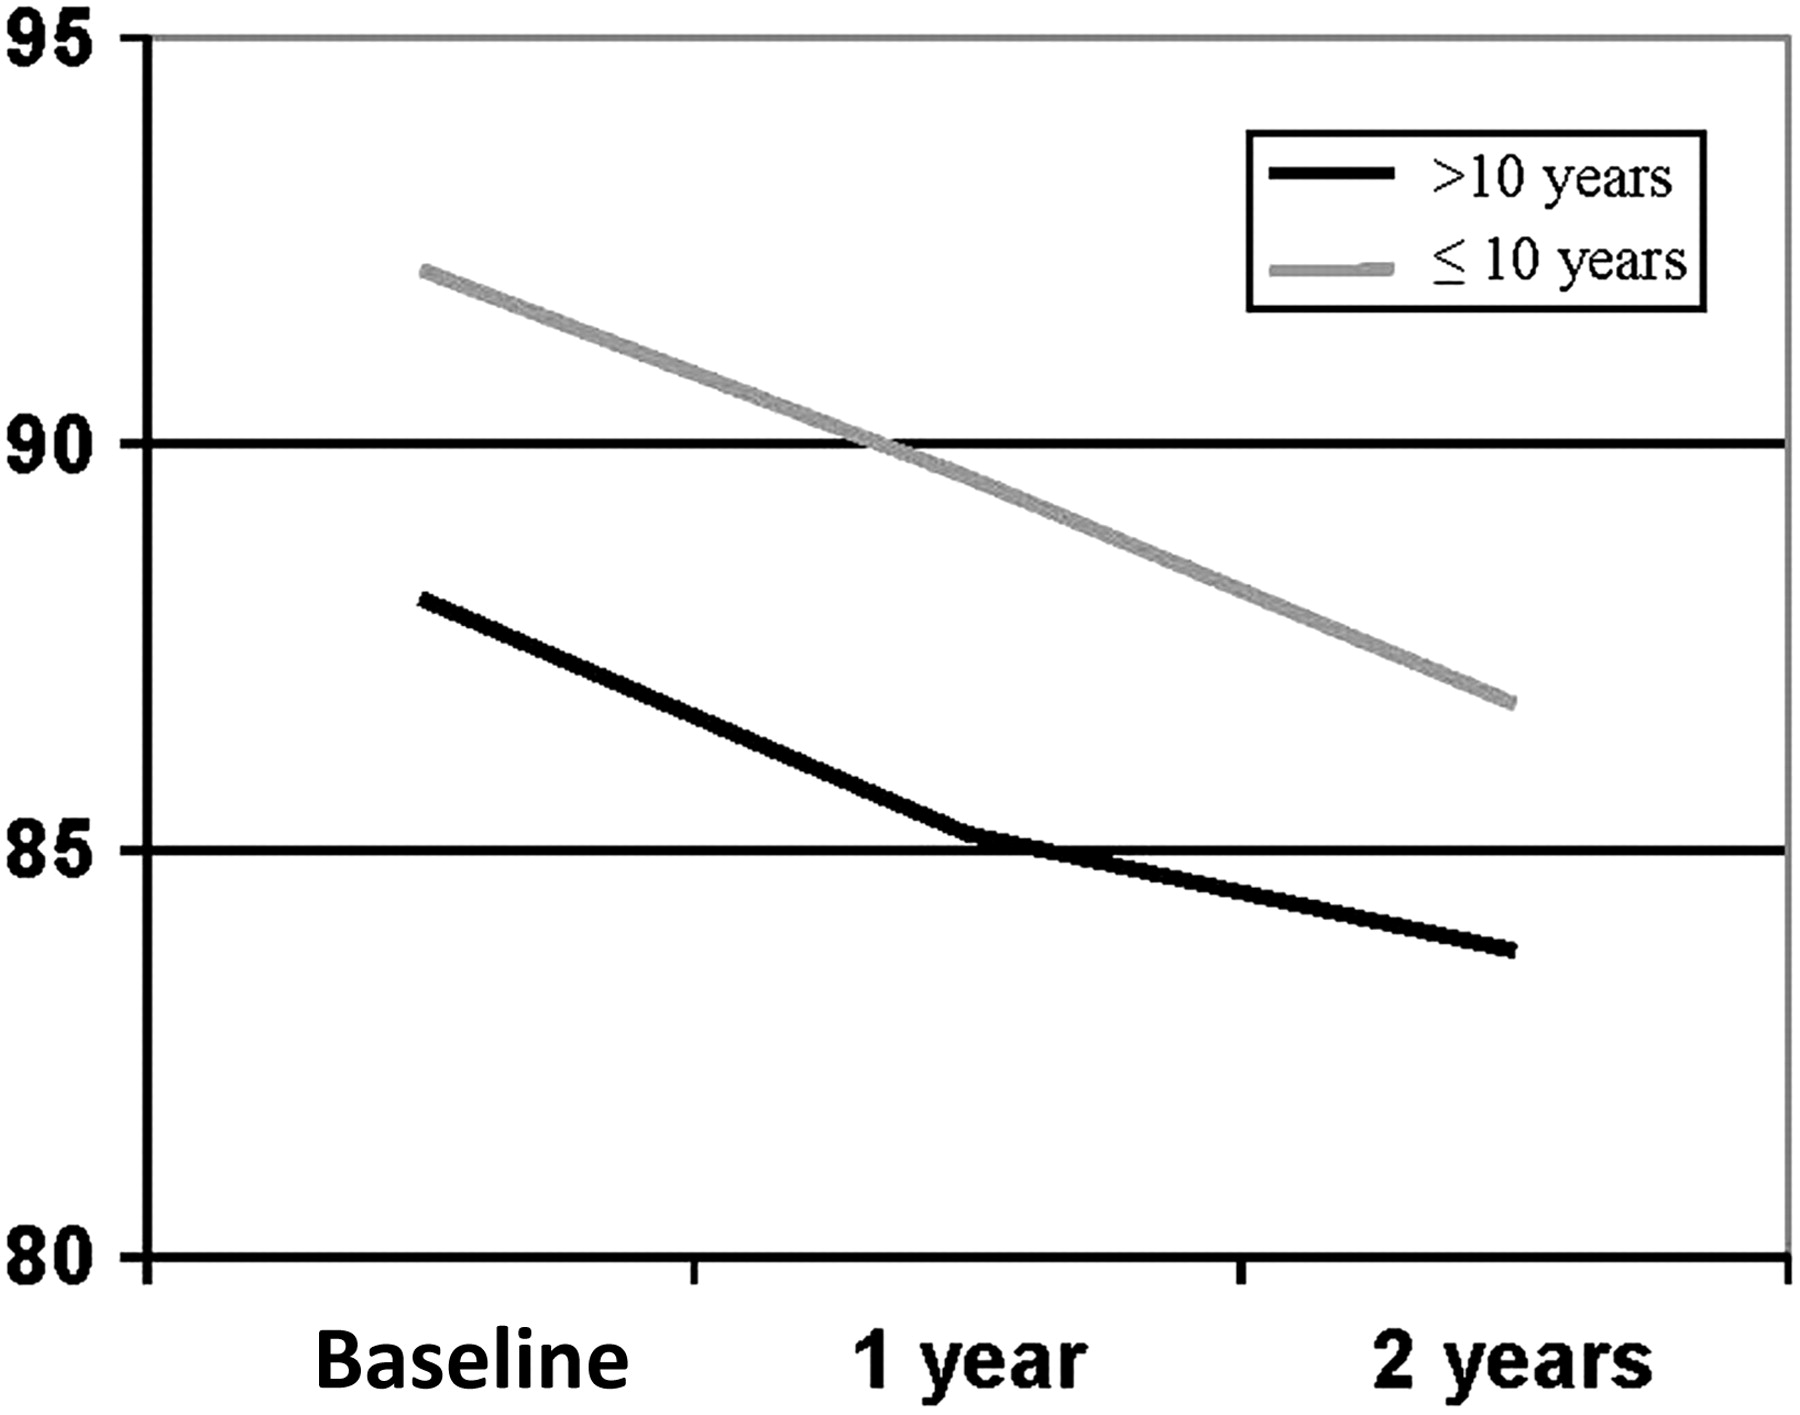
RNFL degeneration at the 2-year follow-up was greater in MS patients with a more recent diagnosis (<10 years), as figure 3 shows. This group presented greater RNFL thicknesses in the three evaluations, but showed greater axonal loss compared with the group with diagnosis greater than 10 years in terms of average thickness as measured by OCT, macular volume with OCT, NFI (p<0.001), inferior average for GDx and latency of VEP.

Representation of change in average thickness measured by OCT during the 2-year follow-up of patients with disease durations longer and shorter than 10 years.
No correlation was found between global EDSS change and RNFL atrophy.
Regression analysis showed that the only parameter that could predict axonal damage was baseline RNFL average thickness because patients with a higher initial average thickness tended to lose more axonal fibres (β=−0.528; p<0.001). Nevertheless, MS relapse(s), gender, disease duration, EDSS and a history of ON were not predictive factors of axonal atrophy (p=0.331, 0.158, 0.403, 0.864 and 0.702, respectively).
Differences in measurement changes were not found between patients with treatment and patients without treatment for MS (p<0.05), except in the EDSS parameter, which showed a higher increase in non-treated group.
Discussion
In recent years, many new instruments have been introduced to quantify the axons of retinal ganglion cells, leading some authors to suggest that changes in the RNFL may reflect similar pathological changes taking place in the brain.2 14
Ocular imaging technologies provide an opportunity for clinical observation of the axonal constituents of the anterior visual pathway. As the RNFL is composed only of unmyelinated axons, measuring RNFL thickness may provide a means for monitoring axonal loss in MS patients.2 6 14–16 A good correlation between RNFL thickness and MRI brain measurements has been described.2 17 18 RNFL atrophy has been demonstrated in MS patients, although this axonal loss is greater in patients who reported a previous ON episode.1 4 12 19 20
We found not only RNFL loss in MS patients with relapses, but also progressive damage with disease evolution. This finding supports the theory that progression of MS may cause axonal loss in the RNFL,12 16 although this damage may be subclinical in nature.21 Henderson et al reported no significant decrease in RNFL thickness between baseline and 575 days follow-up in 34 progressive MS patients and 18 controls subjects, using a time domain OCT device.22 However, we included more participants who were followed-up for a longer time and evaluated with a Fourier domain OCT device.
Since OCT appears to be a useful biomarker for axonal damage in MS patients, we sought to elucidate the characteristics of the disease that result in faster and more severe neuronal damage. We observed a greater decrease in the RNFL of patients suffering a non-visual MS relapse compared with those with no such clinical episodes. This finding supports the idea that these events are not focal but are more widespread in the central nervous system. This could lead to visual impairment with no inflammatory process in the optic nerve. Brain MRI images have shown diffuse axonal damage in vivo in patients with relapses, and several authors considered that atrophy affects the central nervous system in a diffuse manner, although symptoms of acute exacerbations were referred to focal areas.23 24 De Stefano et al reported that diffuse cerebral axonal and tissue injury accrues in non-disabled MS patients who exhibit little evidence of focal demyelination.24 Our study suggests that evaluation of the RNLF could be a useful method to test neurological degeneration in stable patients and after MS relapses.
While our results show that quantitative evaluation of the RNFL thickness is useful to detect progressive changes in MS, a correlation between RNFL loss and functional changes according to the EDSS scale was not found. Nevertheless, 2 years may not be long enough to detect important changes in a progressive and degenerative disease such as MS. To this extent, only 22.9% of patients presented inflammatory episodes during the follow-up, and the mean EDSS at the end of the study was very similar to that at the baseline examination. In our opinion, after a follow-up for a longer period, or by including more patients with relapses in the study, a correlation between EDSS and RNFL reduction could be obtained.
The group of eyes with a previous episode of ON exhibited a greater reduction of RNFL parameters in the baseline evaluation, but further RNFL atrophy was not significantly greater in the longitudinal study. These results suggest that ON episodes cause acute damage to ganglion cells that requires several months to be detected by digital imaging technologies.25 26 By contrast, progressive RNFL atrophy is associated with the disease and is not linked per se to the inflammatory episode. As the time needed to establish the retrograde atrophy after an ON episode is about 6 months,25 we excluded subjects who had presented with visual symptoms from 6 months prior to the baseline evaluation or during the follow-up period. For this reason, RNFL atrophy in our patients was exclusively associated with disease progression or with new MS relapses.
We observed that patients with greater baseline RNFL average thickness or less disease duration exhibited axonal loss to a greater degree over the course of the study, most likely because these subjects had a larger number of ganglion cells to begin with. Our results showed that the mean annual reduction of average RNFL thickness in a healthy subject was 1.40 μm (p<0.001), compared with a higher decrease in MS patients (2.66 μm). Based on these results, the axonal damage due to MS is greater than the physiological loss due to normal RNFL atrophy. To this extent, OCT is a useful technology to detect time-dependent changes in both MS patients and healthy subjects.
In spite of our findings and those of other studies, the emerging concept that the measurement of RNFL thickness should be preferred to the other MRI measurements in clinical studies is still controversial. At present, brain MRI remains the gold standard for determining axonal degeneration in MS, but some authors have suggested that RNFL thickness measurements could be useful to check the progress of neuronal atrophy.17 In addition, ocular imaging technologies are non-invasive, faster and more comfortable for patients.
GDx parameters and functional evaluation showed a reduction in MS patients during the study, but statistically significant differences were not detected. Similar to our observations, other authors have also observed that GDx is less accurate in detecting RNFL abnormalities in neuro-ophthalmological conditions.6 12
Neurologists decide on MS treatment in patients according to symptoms and relapses, so treated and non-treated groups show differences in terms of disease evolution, functional alteration and axonal damage. For this reason, our results comparing both groups should be carefully interpreted.
In conclusion, we have shown that MS patients exhibit a progressive RNFL degeneration that is greater than that observed in healthy subjects and that this degeneration is more evident in patients with a more recent diagnosis who have suffered a relapse. Also, we have found that RNFL atrophy was not significantly greater in the longitudinal study of eyes with previous ON.
References
Footnotes
Study partially presented at the ARVO meeting, May 2009.
Study presented at the 85th Congress of ‘Sociedad Española de Oftalmología’, Sevilla, Spain, September 2009.
Competing interests None.
Patient consent Obtained.
Ethics approval This study was conducted with the approval of the CEICA (Aragon, Spain).
Provenance and peer review Not commissioned; externally peer reviewed.
Linked Articles
- At a glance