Article Text

Abstract
Background The central visual field is particularly affected in age-related macular degeneration (AMD), and this can impinge on a variety of functional tasks, including navigation, which can affect activities of daily living. It has been difficult to assess navigational function under standardised conditions. The aim of this study is to examine gaze function and pupil diameter during navigation in patients with AMD.
Methods This study was designed as an observational case–control investigation. 34 patients with AMD and 23 controls were recruited. We simulated a walking journey using video projection and monitored patients using automated eye tracking. Visual acuity, fixation count, fixation duration and pupil diameter were recorded while subjective measurements included recorded voice comments.
Results The pupil diameters were significantly greater in the AMD group compared with the control group in both easy and difficult segments of navigation (p=0.002). Fixation counts were significantly higher in the AMD group during difficult segments of navigation (p=0.001). The differences in both pupil diameter and fixation count correlated with subject visual acuity.
Conclusions Fixation count is a marker of difficult navigational environments in patients with AMD. The combination of video projection and eye tracking to assess visual navigation function is a useful clinical tool and an adjunct to current investigation tools in AMD intervention studies providing objective clinical measures under standardised settings.
- Macula
- Degeneration
- Diagnostic Tests/Investigation
Statistics from Altmetric.com
Introduction
Age-related macular degeneration (AMD) is the commonest cause of blindness in the developed countries. It is estimated that the prevalence of patients with AMD will continue to increase.1 The central visual field is particularly affected in patients with bilateral AMD. This has an impact on visual task performance and consequently quality of life. The daily tasks found to have the greatest impact of quality of life include reading, driving and navigation.2 In surveys of AMD cases, almost half of the patients did not feel they could reach their local amenities independently while 60% of patients with AMD felt disengaged from the local community and felt that lack of mobility secondary to poor vision was a major contributor to social isolation.3 Additionally, a major fear, contributing to the confidence to navigate, was the fear of falling.4 Eighty-three per cent of elderly visually impaired people also cited this as a major reason for reduced physical activity.5 Taken together this highlights the need to study navigational behaviour in patients with AMD.
Gaze behaviour during daily tasks has been studied extensively in normally sighted people.6–8 However, navigational behaviour has been difficult to investigate under standardised settings. There are some published data on gaze behaviour in people with AMD during reading;9 however, there is little published on gaze behaviour during navigational tasks. This study combines the use of digital projection and eye tracking with the aim of objectively and subjectively assessing navigational function in patients with AMD.
Methods
This study was designed as a non-interventional case–control study. Participants were recruited from patients with clinically confirmed bilateral AMD who were attending the macular clinic in the Princess Alexandra Eye Hospital in Edinburgh. Inclusion criteria included bilateral macular degeneration. Exclusion criteria included other eye pathology, including cataract or glaucoma. Controls were recruited from relatives or friends accompanying patients who had a normal eye examination and vision.
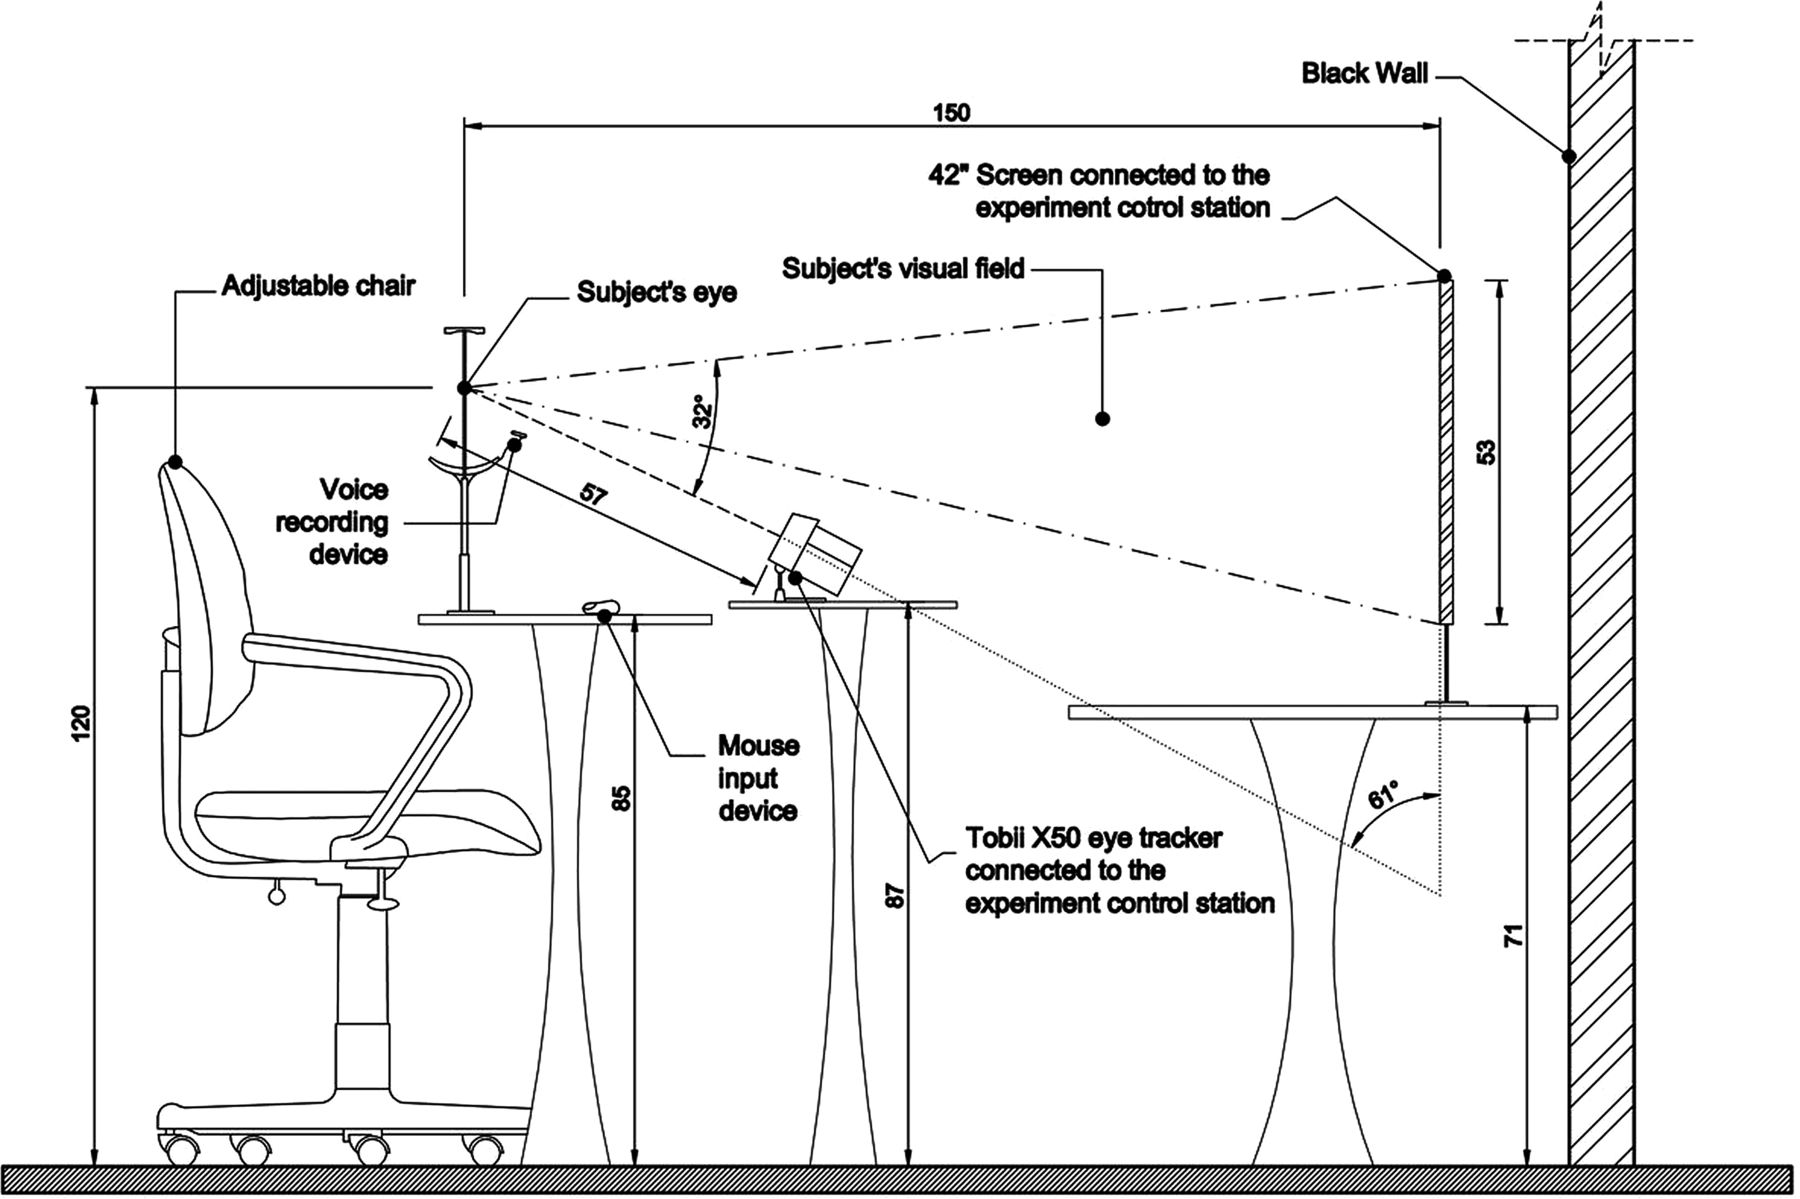
LogMAR visual acuity was measured using a standard illuminated 4 m logMAR chart. Video projection and eye tracking was set up in a similar way to previous published studies.10 A Tobii X50 eye tracker from Tobii Technology, a dual processor laptop and a 42-inch LCD screen (contrast ratio 2500:1) were used. Participants sat 1.5 m from the LCD screen with their chin on a chinrest. This distance allowed the participants to see the whole display area without the eye tracker interfering with the field of view. In addition, the arrangement was within the maximum allowable angle (ie, ±35°) between the tracker and the top edge of the display surface (figure 1).

Set up of projection and eye-tracking equipment.
In order to study function in a navigational context, a film was taken of a journey through a university building on a normal morning. The film was divided into three clips each of approximately 1 min duration. Each segment of clip corresponded to different navigational tasks, including moving down steps, through a door, moving along a side lit corridor, moving through a cluttered area and up internal stairs (see online supplementary information). Segments of each clip were graded as easy or difficult by 12 patients with AMD and 6 experts in the field of environmental design and vision. An example of an excerpt from a film clip with corresponding eye-tracking data is shown in figure 2.

Graphical fixation representation for a patient with age-related macular degeneration approaching a doorway. The area of the circles is proportional to the fixation duration at each point, and the numbers within the circles represent the fixation counts.
Objective measurements taken during the virtual journeys included fixation count, fixation duration and pupil diameter (figure 2). Both cases and controls were played the same footage under the same standard background illumination checked by a photometer (Sekonic L-188). During the clips, a photometer was used to check luminance to see if any pupil size changes were caused by differences in illumination. While watching the films, participants were asked to report into a microphone and press a mouse button when the journey was difficult in terms of safety, reduced confidence or uncertainty. The button presses and recorded comments were used as qualitative measurements.
SPSS statistic V.17.0 was used for all non-regression-based analyses. A correlated component logistic regression was run with M fold cross-validation (CORExpress, Statistical Innovations Inc.)11 to assess which variables independently discriminated patients with AMD and controls. The study was granted research ethics approval by the NHS Lothian research ethics committee study number 08/S1102/5.
Results
In total, 57 people were recruited, of which 34 had bilateral AMD and 23 were controls. The mean age of the AMD subjects (n=34) was 80 years (SD±6.6) while the mean age of controls (n=23) was 76 years (SD±8.0). The AMD group was composed of 11 males (32%) and 23 females (68%) while the control group was composed of 7 males (30%) and 16 females (70%).
The mean logMAR visual acuity of the better eye in the AMD group was 0.43 (SD=0.31) while the mean logMAR visual acuity of the control group in the better eye was 0.03 (SD=0.082). Nineteen per cent of patients in the AMD group had abnormal gross confrontational visual fields, which were attributed to severe macular disease. In order to investigate whether the visual field defect acted as a confounder to gaze and pupil measurements, a regression analysis was performed, which showed no evidence of a difference between control and AMD groups on the basis of visual field data. In order to test for a visual field effect within the AMD group, a Mann–Whitney U test was carried out across all eye-tracking measures for those with full fields (22 subjects) and abnormal fields (9 subjects). This was done for fixation count, duration and pupil size; across four video clips (clips 1, 2, 3 and the average) and including easy and difficult segments. None of the resulting Mann–Whitney U tests reached significance at p=0.05.
Subjective measures
The comments and button presses about the environmental journey from both the control and the AMD groups were similar, although comments were more frequently reported by subjects with macular degeneration. Comments and button presses were especially associated with doors and edges of any environmental boundary such as contrast changes in the floor, steps and doors. The attention is on the floor plane and on door edges and on obstacles near the door edges. There was correspondence between time points of comments and button pushes (see online supplementary information).
Objective measures
Establishing independence of variables
First, to assess whether fixation count, fixation duration and pupil diameter were independent variables, a principal axis factoring analysis was performed with oblique rotation across the full data set. The analysis showed three independent factors corresponding to the three distinct eye-tracking measures. The correlations between the three factors were extremely low (R<0.1). This indicated that the three measures were measured in a different facet of the task. Additionally, the three factors accounted for 85% of the variance in the data, which is a high value for this type of analysis. As a consequence of their independence, separate analyses were performed for each eye-tracking measure. The analysis for fixation counts was equated for task length and is recorded per unit time interval (table 1).
To investigate whether pupil diameter was linked to differential illumination from the film clips being played, an analysis of variance (ANOVA) was performed. Using a photometer in the plane of the pupil, illuminance was recorded at 2 s intervals across the six segments of the video journey (three clips each with easy and difficult segments). An ANOVA gave F=0.49, df=5, p>0.05, indicating no change in illuminance. Hence, illumination differences were unlikely to result in pupil diameter differences.
Summary of fixation count, fixation length and pupil diameter for easy and difficult segments in the AMD and control groups
Correlated component regression analysis for AMD group vs control group
A high-dimensional correlated component linear regression analysis with M-fold cross-validation was carried out to predict correlation differences between patients with AMD and controls. Results showed that the accuracy of the model was maximised when three predictors were present: pupil size during the easy segments, pupil size during the difficult segments and fixation count in the difficult segments of the journeys (see online supplementary information for details of regression analysis).
In order to further confirm the findings of the cross-validation analysis, an ANOVA was performed. For pupil diameter, repeat measures of ANOVA confirmed the difference between the groups (F=11.0, df=1, p=0.002), while in the within levels of difficulty the effect was not significant (F=0.19, df=1, p=0.66) (figure 3).

Pupil diameter differences between control and age-related macular degeneration groups for the easy (EPS) and difficult (DPS) parts of the journey.
For fixation counts, the differences between the groups were not significant (F=1.02, df=1. p=0.3); however, when the analysis compared difficult and easy segments of journeys, the differences in fixation counts were significant (F=55.0, df=1, p<0.001). These differences are graphically represented in figure 4.

Plots of fixation counts for the age-related macular degeneration and control groups for the easy (EFC) and difficult (DFC) parts of the journey.
Disease severity and identified factors
To further assess validity of the newly identified measures, an assessment of whether pupil diameter and fixation count differences were greater with disease severity was performed. A correlation analysis of logMAR visual acuity in the better eye and either pupil diameter or fixation count was undertaken. The analysis showed significant associations between visual acuity and fixation counts and visual acuity and pupil size for both the easy and the difficult parts of the journey. These were r=0.37, p=0.01 for pupil size during easy segments, r=0.34, p=0.013 for pupil size during difficult segments and r=0.31, p=0.02 for fixation counts, respectively. No significant correlation was found between visual acuity and fixation length. These figures further supported the evidence that pupil size and fixation count differed in the AMD group compared with the normal age-matched and sex-matched controls.
Discussion
In subjects with normal vision when navigating difficult sections, there is an increase in fixation counts and duration.5 Normally sighted subjects direct the majority of their fixations onto goal-orientated objects and fixation duration is task dependent.12 In this study, fixation count in difficult segments of the journey and pupil size in all segments of journeys were greater in the AMD group compared with the controls. Fixation count has been shown to be negatively correlated with search efficiency, which is in turn linked to uncertainty or lack of meaningfulness with regards to an object.13 ,14 This corresponds with the findings in this study in which areas identified as ‘uncertain’ subjectively had higher fixation counts in the AMD visual acuity groups. The clips deliberately contained segments that have previously been shown to cause problems during navigation, including coloured lights, monochrome environments, surfaces lacking contrast or causing glare and the lack of transition lighting when going from dark to light.15 A previous study looking at road crossing behaviour in AMD cases also found that they had greater fixation counts on objects that may cause danger such as cars when comparing gaze pattern with normal controls.5
The gaze behaviour identified may also be disease specific. Gaze during navigation in cortical blindness, for example, is similar to that in normally sighted individuals, which contrasts to gaze behaviour when stationary.16 In AMD, this may be due to eccentric fixation when central vision is lost.17 Additionally, loss of central vision may change gaze centres centrally.18 This may account for the increased fixation counts seen in this study with worsening central vision. Eccentric fixation was not formally assessed in this study. In a future study, it would be interesting to see whether navigational fixation counts were affected by the eccentricity of fixation. This could be assessed by screening patients using microperimetry prior to navigational gaze assessment.
Pupil dilation is complex as it is influenced by many factors. Illumination is perhaps the biggest effector.19 However, no significant difference in illumination was found within or between the different clips. Pupil size is known to be affected by mental effort.20–22 This most likely results from activation of the sympathetic pathway with the release of norepinephrine.23 Fixation duration has been linked to difficulty when extracting visual information from a scene.13 In this study, however, no difference was found for fixation duration during different navigational tasks.
When extrapolating findings in this study to the real world, the findings may have some limitations. Navigation involves a coordination between different sensory inputs, processing of information and motor output. As the aim of the study was to investigate eye movements and pupil dilation, the effect of motor function and other sensory inputs such as proprioception was not assessed in this study. Additionally, it would have been useful to study micro saccadic activity in patients with AMD. This may be possible in future studies with the latest eye trackers.
Recently, sophisticated and costly therapies have been introduced in the treatment of macular degeneration and this is set against a background of ongoing studies into potential therapies.24 ,25 It is therefore increasingly important to be able to assess function in order to compare real-world efficacy. This study demonstrates that the combined use of eye tracking and video projection provides a relatively cheap, simple, reliable and valid tool to investigate navigational function in patients with AMD under standardised conditions as well as highlighting potential markers of difficult navigational function.
Acknowledgments
The authors wish to thank the Macular Society for the funding to support this study.
References
Supplementary materials
Supplementary Data
This web only file has been produced by the BMJ Publishing Group from an electronic file supplied by the author(s) and has not been edited for content.
Files in this Data Supplement:
- Data supplement 1 - Online supplement
- Data supplement 2 - Online Regression
- Data supplement 3 - Online segment of film clip
Footnotes
-
Contributors The study was proposed by PAA, AM and BD. The study was designed by CA, PAA, AM and BD. Data collection was performed by SB, RG, GL and MG. Analysis was performed by PAA. Writing and editing of the article was performed by SB, BD and PA.
-
Funding This study received funding from the Macular Society.
-
Competing interests None.
-
Ethics approval The study was granted research ethics approval by the NHS Lothian research ethics committee study number 08/S1102/5.
-
Provenance and peer review Not commissioned; externally peer reviewed.