Article Text

Statistics from Altmetric.com
Introduction
Since its first reported clinical application in 1994, wavefront technology has broadened the spectrum of laser refractive surgery.1 ,2 Modern microincisional phacoemulsification techniques have increased the expectations of patients and surgeons that accurate refractive outcomes can be achieved. However, in terms of refractive outcomes, these expectations are not always met because the proposed National Health Service (NHS) minimum targets for refractive outcomes in virgin eyes, which are currently 55% within 0.5D and 85% within 1D of emmetropia, are not reached in every case3.
Real-time biometry during cataract surgery could address this shortcoming by informing and, thereby, improving the surgical outcome. This may be especially valuable in complicated cases, for instance, after refractive surgery.4 ,5 Experiments have demonstrated that objective refraction methods based on wavefront aberration maps can accurately predict the outcome of subjective refraction and may possibly be even more precise.6
Numerous studies have shown that intraoperative Wavefront aberrometry (IWA) seems feasible, and some have argued that it may well become a necessary tool in future cataract surgery.1 ,2 ,7 In light of the growing body of research on its application, we should critically question the reliability of intraoperative WA in producing stable results. To date, the quality and precision of intraoperative WA have not been assessed systematically at all. This report is the first to provide data on these vital parameters.
Design
This prospective study draws upon data gathered from 74 patients attending the Hamburg University Eye Hospital for routine cataract surgery between March 2010 and December 2010, and was approved by the Hamburg ethical committee, fulfilling the conditions of the declaration of Helsinki.
Preoperative measurements were conducted on 80 eyes, including uncorrected (UDVA) and corrected distance visual acuity (CDVA), manifest refraction and standard slitlamp examination. Out of six patients who underwent surgery in both eyes, only one eye was randomly selected for analysis. Aberrometry refraction with the Wavefront Supported Custom Ablation (WASCA) (Zeiss Meditec, Germany) at a vertex distance of 12 mm and corneal tomography (Pentacam, Oculus, Germany) was obtained under conditions of physiological mydriasis in dim light. Participants with ocular comorbidity were not included (see our precursor study8).
Intraocular lens (IOL) calculation was performed using the Haigis formula with the IOL-Master (V.3, Zeiss Meditec). The surgical technique followed a standard routine and was performed by three surgeons (SJL, TK and GR) all of whom used the same lid speculum, ophthalmic viscosurgical device (OVD, Polyvisc 2%, Polytech, Germany) and superior trapezoidal 2.4 mm clear corneal incision (CCI). Surgery was not altered (although it was delayed) by the WA measurements. A continuous circular capsulorrhexis was created, aiming for a diameter of 6 mm. Phacoemulsification was performed with a vertical chop technique. In all cases, the same foldable IOL (A-constant=118.4) was implanted in the capsular bag. On day 1 postoperative, a standardised follow-up examination took place including WASCA measurements.
Intraoperative data on sphere, cylinder and axis were generated for a back vertex distance of 12 mm with a CE-certified commercially available aberrometer (dynamic range from −10 to +25D sphere and 5D of cylinder) that was mounted on the surgical microscope (Zeiss OPMI Lumera T). The aberrometer uses an infrared wavelength of 850 nm.
Seven intraoperative measurements were performed during each operation at defined steps during the procedure (see table 1). Three measurements were attempted in aphakia and again in pseudophakia. Before each measurement was taken, the surgeon filled the anterior chamber (AC) with either balanced salt solution (BSS) or OVD, aiming for a normotensive intraocular pressure, which he controlled on palpation. Correct alignment of the visual axis was controlled by inspection of the Purkinje–Sanson images I and II through the operating microscope. An assistant was then asked to take the measurement.
Aberrometry refraction before, during and 1 day after cataract surgery
To determine WF quality, we calculated the WF map’s percentage in a standardised automated procedure with ImageJ (V.1.47 g for Mac9). Objective cataract staging was performed with the Pentacam Nuclear Staging (PNS) analysis.10
Statistical Analysis
The data was analysed with STATA (release V.11, StataCorp 2009). Conventionally scaled refraction poses a problem for statistical analysis. For this reason, Thibos and Horner's formulas (ref. 11, p.81) were used to transform refraction values into the power vector components of spherical equivalent (SE), Jackson cross-cylinder at 0° and 45° (J0 and J45) and Bluriness vector (B).
To illustrate disparities between the measurements, we calculated absolute differences and reported them using box plots. Bland–Altman plots on SE differences and test-retest reliability coefficients as a measure for intraclass correlations were computed for preoperative versus intraoperative readings, and for repeated measurements during aphakia and pseudophakia. Retrospectively, calculations on sample sizes and test power were performed. OR from the logistic regressions for predicting measurement failure were calculated. Repeated-measure Analysis of variance (ANOVA) was applied, to test whether effects could be explained by the three different surgeons performing the operations (SJL 30, TK 28, GR 16 eyes, respectively), or by variability in age, refractive state and CDVA. Partial eta squared as a measure of explanatory power is presented for these variables.
Results
The study population encompassed 74 eyes (34 right and 40 left eyes) from 74 patients (42 male and 32 female). The mean age of the patients was 69.0 (SD 11.3) years, and the baseline manifest refraction was +0.31 sphere (SD 2.9) and −1.1 cylinder (SD 1.05).
Table 1 provides an overview of descriptive statistics on preoperative intraoperative and postoperative WA refractive data.
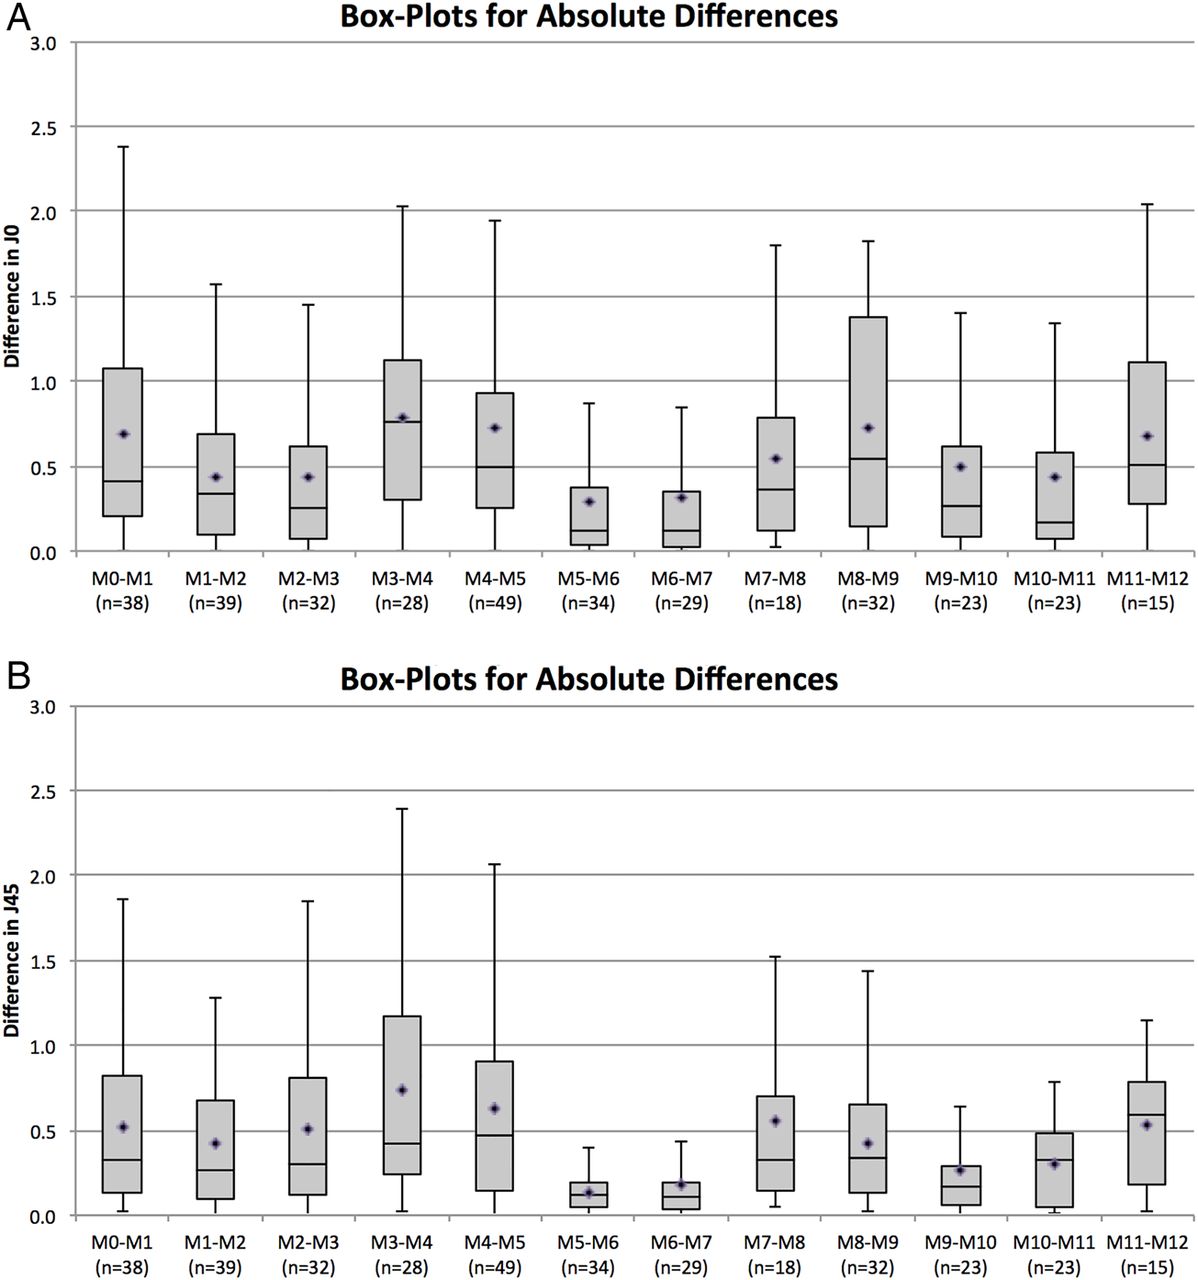
Figure 1A plots the median absolute differences of SE between neighbouring measurement points. The detailed differences between the preoperative measurement on the seated patient versus the first intraoperative measurement are shown in figure 1B. Repeated SE measurements with limits of agreements in aphakia and pseudophakia are shown in figure 2A and B. Test-retest reliability amounted to 0.98 and 0.88, respectively, which being >0.75 can be classified as good.12 Figure 3A and B plot the mean absolute differences of J0 and J45 between neighbouring measurement points (black circles).

Absolute differences of spherical equivalent (SE). (A) Median absolute differences of SE between neighbouring measurement points (line within the box) with their respective quartiles (top and bottom of the box) and mean absolute differences (rhombus within the box, all ps<0.05). (B) Bland–Altman plot comparing preoperative SE measurements on the seated patient versus the first intraoperative measurement on the horizontal patient. Mean difference is shown by solid black line and limits of agreement by dashed lines. The 95% CIs for the lower and upper limits of agreement are −4.35 to −2.56 D and 3.62 to 1.83 D, respectively. Based on the sample size (N=38), a test power of 80% at the 0.05 significance level was achieved for a mean difference of ≤ 0.9 D (±1.58). Measurement points M0-12 and differing Ns across those are explained in table 1.

Spherical equivalent (SE) reproducibility in aphakia and pseudophakia; (A) Bland–Altman plot comparing threefold repeated SE measurements in aphakia. Mean difference is shown by solid black line and limits of agreement by dashed lines. The 95% CIs for the lower and upper limits of agreement are −0.96 to −0.47 D and 0.93 to 0.44 D, respectively. Based on the sample size (n=27), a test power of 80% at the 0.05 significance level was achieved for a mean difference of ≤0.2 D (±0.36). (B) Bland–Altman plot comparing threefold repeated SE measurements in pseudophakia after removal of ophthalmic viscosurgical device (OVD). The 95% CIs for the lower and upper limits of agreement are −2.14 to −0.94 D and 2.13 to 0.93 D, respectively. Based on the sample size (n=22), a test power of 80% at the 0.05 significance level was achieved for a mean difference of ≤0.45 D (±0.78). Measurement points M0-12 and differing Ns across those are explained in table 1.

Absolute differences of JO (A) and J45 (B) between neighbouring measurement points (line within the box) with their respective quartiles (top and bottom of the box) and mean absolute differences (rhombus within the box, all ps<0.05). Repeated J0 measurements in the aphakic state revealed a mean difference of 0.31D (limits of agreement (d±1.96 s) +0.77 D and −0.8 D) and, respectively, of 0.41 –D (limits of agreement (d±1.96 s) +0.55D and −0.49D) in pseudophakia. Test-retest reliability amounted to 0.73 (aphakia) and 0.67 (pseudophakia). Repeated J45 measurements in the aphakic state revealed a mean difference of 0.36D (limits of agreement (d±1.96 s) +0.67 D and −0.71 D) and, respectively, of 0.43D (limits of agreement (d±1.96 s) +0.85D and −0.60D) in pseudophakia. Test-retest reliability amounted to 0.80 (aphakia) and 0.78 (pseudophakia). Measurement points M0-12 and differing Ns across those are explained in table 1.
Out of a gross number of 814 intraoperative measurement attempts, 462 readings succeeded in recording a wavefront map. Sixteen maps were excluded from analysis because the cylinder measurements were outside the dynamic range of the aberrometer (all spherical measurements were within range).
As expected, the WF map quality of excluded eyes was significantly lower than the one included (19.11% (SD 16.15) excluded versus 39.78% (SD 18.58) included eyes, p<0.001). ORs predicting measurement failure showed that only CDVA significantly influenced results at some instances as table 2 shows.
OR from the logistic regressions for predicting measurement failure (=1)
Across all measurement points, all maps with refractions within the dynamic range of the aberrometer were graded in terms of their total area. The highest total number of successful readings (n=63) was achieved in aphakia with OVD. The highest (50.63%, SD 20.23) and lowest (29.19%, SD 13.94) quality of wavefront maps (WFM) were found after CCI and in pseudophakia with OVD, respectively (100% corresponds to the highest possible area; see figure 4).

Mean wavefront map quality of consecutive intraoperative wavefront aberrometry (WA) measurements (with SD) in terms of relative WF map integrity (100% corresponds to the highest possible area). Measurement points M0-12 and differing Ns across those are explained in table 1.
The mean cyclotorsional deviation of axis for all eyes between the seated and the supine patient amounted to 3.84° (SD±64.8°, n=37). When comparing the last intraoperative supine reading with the upright one from the following day, a mean cyclotorsion of −14.5° (SD±68°, n=14) was noted. Both effects were statistically not significant (t(37)=0.365, p=0.359 and t(14)=−0.0.82, p=0.789).
Repeated-measure ANOVA revealed that the observed effects could not be explained by the surgeon factor. There was no significant interaction between either WF map quality across surgeons during repeated measurements in pseudophakia (F(4, 46)=2.189, p=0.085) or in aphakia (F(4, 38)=1.315, p=0.282). No statistically significant explanatory variables for threefold measurements in aphakia and pseudophakia were found (table 3).
Partial eta squared (η2) for the explanatory variables in mixed ANOVA models for threefold measurements in aphakia and pseudophakia
Table 4 describes a strong but not significant association between PNS grade and preoperative visual acuity in an expected positive relationship, that is, the higher the PNS grade, the higher the CDVA (LogMar).
Visual acuity versus PNS grade
No statistically significant relationship was found between PNS grade and WF quality scores (all ps>0.05).
Discussion
Our data suggest that although IWA is practically feasible, it succeeded only in 56.8% of all measurement attempts during cataract surgery. The quality of the measurements that succeeded shows considerable variation across the single steps of the surgical procedure.
Reproducibility and repeatability are two sides of the same coin, called precision.12 Repeatability describes variability in repeated measures under constant conditions; for example, our repeated WA recordings in aphakia. Reproducibility is used when those conditions change, for example, comparing the WA scores before and after the IOL implantation.
In terms of reproducibility, our data show high accuracy across most intraoperative measurement points, illustrated in figures 1A and 3. A value of zero indicates that no change in SE (or J0/J45) occurred between neighbouring measurement points. Two marked exceptions in SE differences exist. First, as one would expect, the difference before versus after the removal of the cataract is high, theoretically corresponding to the effective power of the crystalline lens in situ. Second, the inverse applies before versus after IOL implantation.
Interestingly, the measurement differences between the respective following steps (aphakia with BSS vs OVD, and pseudophakia with OVD vs removed OVD) showed high variation in both instances. OVD has a similar refractive index as BSS/aqueous humour (eg, 1.339 for commonly used OVD vs 1.336 for aqueous humour). Thus, a possible reason may be that OVD enables a more homogeneous filling of the AC than BSS, resulting in more stable measurement conditions. Our data with a slightly higher WA quality score for OVD supports this view (figure 4). This stands in contrast to Wong et al13 who state that better results should be expected under BSS. In our view, stable AC conditions are of key importance for successful IWA.
We noticed a SE shift of −0.37D between the preoperative WA assessment on the seated patient versus the first measurement on the supine patient in theatre (figure 1B). It is a well-known phenomenon that WF aberrometers tend to give more myopic SE than manifest refraction (eg, −0.41D in a recent study14). However, one would not expect such a marked difference between two devices working according to the same Hartmann–Shack principle. This effect may be caused by the posture change of the patient, but it seems likely that other factors, such as the lid speculum, are also causative. Indeed, one study found it to be responsible for significant changes in cylinder power and axis depending on how much the patient squeezed.15 The extent of our observed cyclotorsion showed very high deviations, which were approximately twice as high as in another aberrometry study.16 We recommend, therefore, that IWA is not relied on as the sole source for surgical decisions on astigmatic corrections but is, instead, always supplemented by conventional marking methods.17 It would be helpful if future devices had an inbuilt method to compensate for cyclotorsion, for example, with reference to anatomical structures of the iris or limbal vessels, rotating the WF map accordingly.
In terms of repeatability, the Bland–Altman plots demonstrate that repeated IWA measurements in aphakia and pseudophakia showed high reliability (figure 2A, B). However, the clinical interpretation of the agreement range, which is vital to the limits of agreements approach,12 shows for instance, that SE in aphakia varies from +0.69 to −0.72 D, which seems too large if one wanted to base an intraoperative IOL calculation on IWA. The large range of this example is derived from a small sample (n=27), and a bigger sample size should provide a more accurate assessment of those limits of agreement.12
Quality of IWA
IWA only succeeded in 56.8% of all measurement attempts during cataract surgery. In a lower-powered study, this ratio was as low as 25%.15 In our attempt to understand this trend, we examined the impact of certain variables on measurement failure by calculating the ORs from logistic regressions (table 2). Except for CDVA, no variable had a statistically significant impact on measurement success. Hence, a preoperatively low CDVA (ie, a high CDVA logMar score) resulted in a significant 9.49-fold increased chance of measurement failure for the first intraoperative measurement. This may be explained by the fact that eyes with low CDVA are likely to have a more progressed cataract (table 4) which, in turn, may explain measurement failure before it has been removed.
We observed remarkable variation in WF quality across the surgical steps (figure 4). With increasing WF quality, more precise measurements were achieved. This was especially true for repeated measurements in aphakia, where high WF quality was associated with significant lower mean measurement differences in SE (p<0.05). A limitation of our study is whether WF area is a reliable surrogate parameter for measurement quality, and further research should seek to establish a firmer connection between those two parameters. Future aberrometers should have an integrated quality measurement, for example, based on WFM area as we propose.
Factors impacting on precision and quality of IWA
In addition to the effect of the lid speculum discussed above, we identified five other factors that may impair the precision and quality of the vulnerable IWA measurements. First, topical anaesthesia and corneal wound hydration may lead to an altered corneal curvature, resulting in significant changes of refraction. Second, hydration of the vitreous, especially in pseudophakia. Third, a varying effective IOL position, for instance, in a slightly more anterior position in an eye with a large capsulorrhexis may influence measurements. Fourth, when the surgery is performed under topical anaesthesia, patients’ eye movements are a source of error. Fifth and most importantly, the intraoperative state is not physiological. Hence, AC depth may show great variation during surgery; for instance, an increase in aphakia, leading to significant alterations of the refractive state of the eye.
We would expect that some of these variables could be controlled by intraoperative optical coherence tomography (OCT) measurements of AC depth and real-time monitoring of intraocular pressure. In our study, we tried to make sure the intraocular pressure (IOP) was normotone on palpation before each reading was taken, but this is a highly subjective method. An automated eye-tracking of the IWA would be highly desirable to overcome fixation problems, and a combination of IWA with femtolaser-assisted phacoemulsification seems to promise much in the advancement of standardised surgical techniques.
General discussion
Before IWA can be used to guide the surgical plan, for example, for astigmatism correction during cataract surgery (as previously reported with a Talbot Moiré interferometry device7) or to generate constant dynamic data for intraoperative biometry,18 further efforts are needed to enhance the measurement precision and quality of IWA.
To judge the success of an objective method of refraction, a ‘gold standard’ for comparison is required,19 which, to date, does not exist for intraoperative refraction. Some authors have used intraoperative autorefractive retinoscopy for intraocular lens power estimation13 ,20 ,21). Difficulties arise when comparing manifest refraction, autorefraction and aberrometry-based refraction with each other, for example, by different reference plane distances of refraction22, and this is also a limitation of our study. Whereas manifest refraction is determined by polychromatic light, WA is based on invisible monochromatic infrared light. Thus, surgical correction of monochromatic aberrations could be of limited value. In the quest for a gold standard for intraoperative refraction, future studies should seek to establish benchmarks in comparing different methods of intraoperative autorefraction in a randomised controlled trial.
In conclusion, IWA seems feasible without disturbing the surgical workflow, but more efforts are required to improve the precision and quality of measurements before it can be brought to use to guide the surgical refractive plan during cataract surgery.
Acknowledgments
We are grateful to Wayne Veck, PhD, and Inderpaul Sian, MD for their revision of the manuscript, and to the optometrist Jan Dräger for data collection.
References
Footnotes
-
Contributors Conceived the study's questions: SJL GR TK JOH MP. Developed the manuscript: JOH SJL TK. Coordinated the manuscript development: JOH. Completed first draft of the manuscript: JOH. Edited the manuscript: SJL VD JOH. Performed part of writing or editing of the manuscript: SJL VD. Made an intellectual contribution to the manuscript: JS GR TK MP. Calculated statistics: VD JOH. Advised on the manuscript: SJL JS TK. Approved final version of the manuscript prior to submission: SJL GR JS JOH. Guarantor: GR. Collected data: MP.
-
Funding The authors have full control of all primary data and agree to allow BJO to review the data upon request. Financial relationships with the organisations that provided the instruments used in this study do not exist. The authors have no proprietary or commercial interests in any material or methods discussed in this paper. The authors do not report any conflict of interest or opinion. No financial support was received for this study. A presentation on parts of this study has been delivered by J. O. Huelle to the 27. DGII congress, 11.-13. of April 2013, Heidelberg, Germany and was awarded with a prize for the best scientific presentation.
-
Competing interests None.
-
Ethics approval Hamburg ethical committee.
-
Provenance and peer review Not commissioned; externally peer reviewed.
-
Data sharing statement The authors have full control of all primary data and agree to allow BJO to review the data upon request.