Article Text

Abstract
Aims To report the changes of the choroidal structure in the enhanced depth imaging optical coherence tomographic (EDI-OCT) images after high-dose corticosteroid treatment for acute Vogt–Koyanagi–Harada (VKH) disease.
Methods Retrospective, observational case series. Thirty-four eyes of 17 patients with acute VKH disease were examined by EDI-OCT before, and 1, 4 and 52 weeks after the treatment. The EDI-OCT images were binarised by ImageJ, a publicly accessible software. The luminal, stromal and total choroidal areas and ratio of luminal/stromal area (L/S ratio) were measured in the subfoveal choroid of 1500 µm width. The area of the peripapillary atrophy (PPA) was measured in the fundus photographs at 1 and 52 weeks. For statistical analyses, a generalised estimating equation method was used to eliminate the effect of within-subject intereye correlations.
Results Before treatment, the EDI-OCT images could not be binarised because of poor image quality in most of the cases. After treatment, the luminal, stromal and total choroidal areas were significantly decreased during the follow-up period (all p<0.05). The L/S ratio significantly fluctuated over time (p=0.0201), and was significantly lower at 4 weeks than at 1 week (p=0.0158). The L/S ratio at 1 week was significantly correlated with increase in the PPA area, subsequent chronic recurrences and total dose of corticosteroid (p<0.0001, p=0.0006, p=0.0037, respectively).
Conclusions The L/S ratio measured by binarisation of EDI-OCT images was predictive factor for the progression of PPA, subsequent chronic recurrences and total dose of corticosteroid, and may serve as a marker for degree of choroidal inflammation in the VKH disease.
- Choroid
- Imaging
- Inflammation
- Treatment Medical
Statistics from Altmetric.com
Introduction
Vogt–Koyanagi–Harada (VKH) disease is an autoimmune inflammatory disorder which affects pigmented tissues in the ocular, auditory, skin and central nervous systems in genetically susceptible individuals.1 ,2 Histopathological observations showed an infiltration of lymphocytes and the absence of melanocytes in the choroid.2–4 In addition, indocyanine green angiography showed early hyperfluorescence and leakage of the choroidal stromal vessel, and hypofluorescent dark dots that suggested choroidal vasculitis or choroidal granulomas.5
Enhanced depth imaging (EDI) optical coherence tomography (OCT) based on spectral-domain OCT (SD-OCT) technology has allowed clinicians to examine the choroid in eyes with various pathologies.6 Earlier studies using EDI-OCT showed that the subfoveal choroidal thickness was markedly increased in the acute phase of VKH disease and decreased rapidly after systemic corticosteroid therapy.7–9 As best as we know, there has been no report describing the changes of the choroidal structure, that is, the relationship between the luminal and stromal areas, in cases of VKH disease after treatment. We recently reported that EDI-OCT images can be converted to binary images, which can then be used to quantify the luminal and stromal areas of the choroid.10–12 We used this technique to quantify the luminal and stromal areas of the choroid in eyes with VKH disease before and after conventional corticosteroid treatment.
Thus, the purpose of this study was to determine the changes of the luminal and stromal areas of the choroid after standardised corticosteroid treatment in eyes with VKH disease.
Materials and methods
This was a retrospective, observational case series of 34 eyes of 17 treatment-naïve patients (seven men and 10 women) with acute VKH disease. The patients were examined by EDI-OCT before and 1, 4 and 52 weeks after systemic high-dose corticosteroid treatment. All patients were examined within 1 month of the onset of the symptoms. The age of the patients at presentation ranged from 29 to 83 years (mean, 54.9 years). In addition, 50 eyes of 25 normal individuals controlled by age and refractive error were examined by EDI-OCT. Approval was obtained from the Institutional Review Board of Tokushima University Hospital prior to beginning this study, and the patients gave their written informed consent prior to their inclusion in the study. The procedures used in this study adhered to the tenets of the Declaration of Helsinki.
The inclusion criteria were complete or incomplete VKH disease as determined by the Revised Diagnostic Criteria proposed by the International Nomenclature Committee.13 In all patients, multiple leaks from the level of the retinal pigment epithelium (RPE) and staining of the optic nerve were seen in the fluorescein angiograms, and delayed patchy filling with indistinct choroidal vessels in the indocyanine green angiograms. Patients with other uveitic conditions determined by their medical history and/or laboratory findings were excluded. None of the patients had a history of penetrating ocular trauma or intraocular surgery and myopic refractive error greater than −6.0 dioptres.
All patients were initially treated with intravenous pulsed methylprednisolone consisting of 1000 mg/day for 3 days followed by oral prednisolone. Some patients received additional intravenous pulse methylprednisolone based on the degree of remaining exudative retinal detachment.
All patients had a standard ophthalmological examination before and after the high-dose corticosteroid treatment. SD-OCT was performed with the Heidelberg Spectralis (Heidelberg Engineering, Heidelberg, Germany). The subfoveal choroidal thickness was manually measured using the calliper function, and the average thicknesses of the vertical and horizontal scans were used for each eye.
Evaluation of luminal, stromal and overall choroidal areas by binarisation technique
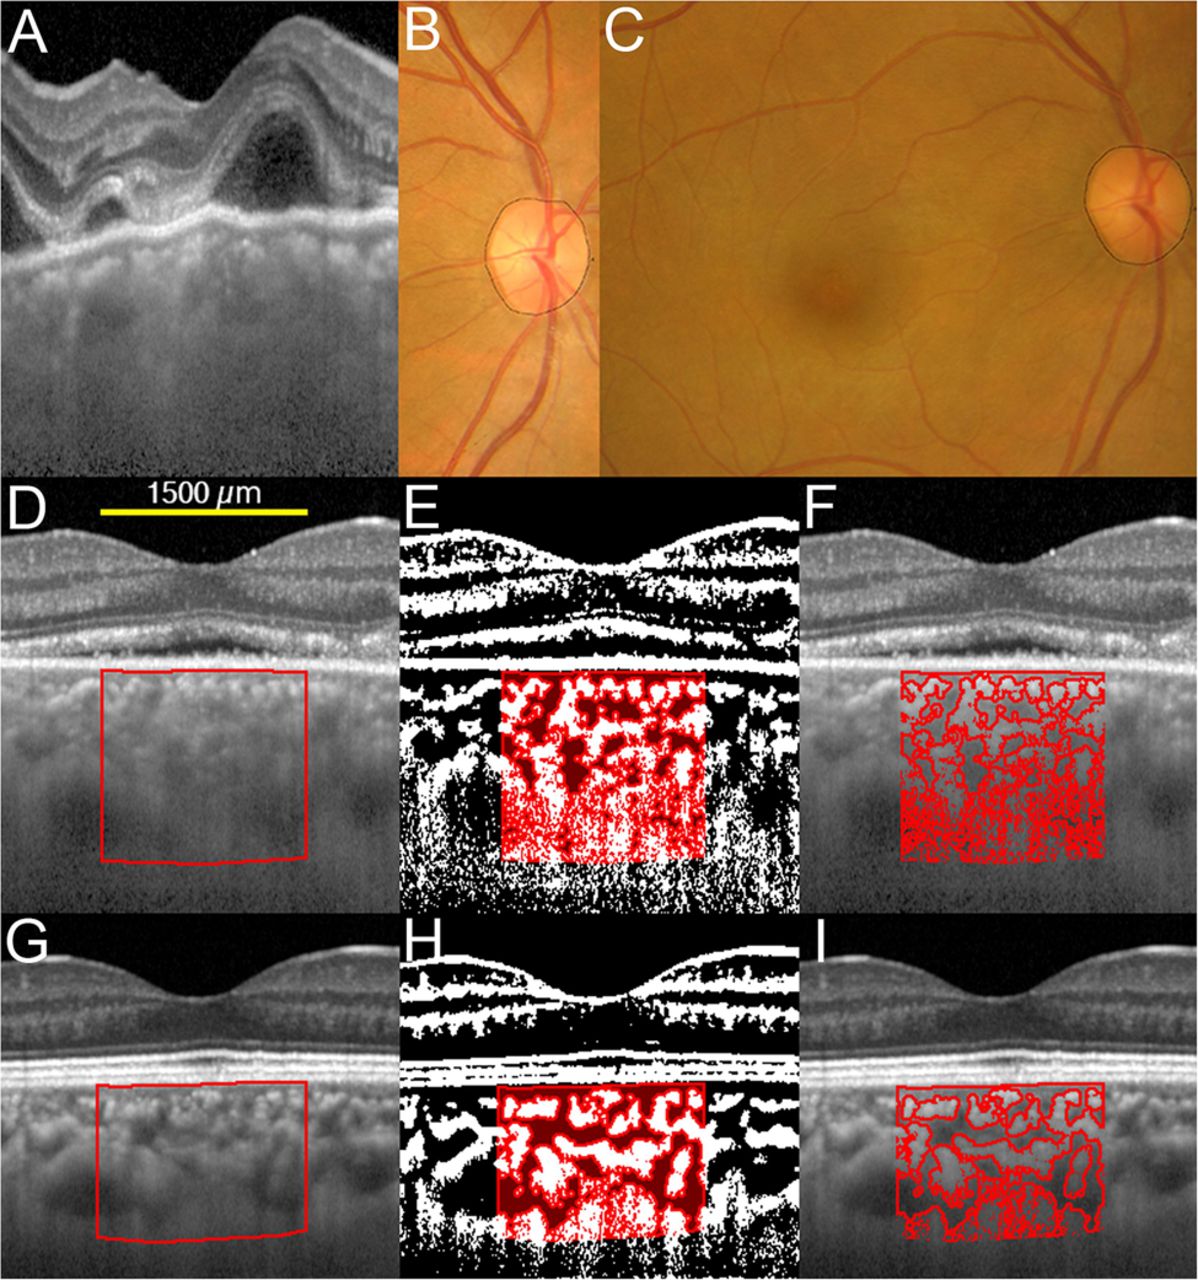
Binarisation of the EDI-OCT image was done by a modified Niblack's method as described in detail (figures 1 and 2).10 The EDI-OCT images were analysed with the ImageJ software (ImageJ, V.1.47, NIH, Bethesda, Maryland, USA). One of the authors (KS) who were masked to the clinical findings performed binarisation of the EDI-OCT images. The examined area was 1500 µm wide in the subfoveal choroid centred on the fovea, and extended vertically from the RPE to the chorioscleral border. The examined area was selected with the ImageJ ROI Manager. Three choroidal vessels with lumens larger than 100 µm were randomly selected by the Oval Selection Tool on the ImageJ tool bar, and the average reflectivity of these areas was determined. This average reflectivity of these three areas was set as the minimum value to minimise noise in the EDI-OCT image. Then, the image was converted to an 8 bit image and adjusted by the Niblack Auto Local Threshold. The binarised image was converted to the RGB (red-green-blue) image again, and the luminal area was determined using the Threshold Tool. The light pixels were defined as the stromal areas, and the dark pixels were defined as the luminal areas. After adding the data of the distance of each pixel, the luminal and stromal areas were automatically calculated. Binarisation of the EDI-OCT image was done three times for each image, and the three measurements were averaged. In addition, intraclass correlation coefficient (ICC) was calculated to evaluate intrarater agreement.

Enhanced depth imaging optical coherence tomographic (EDI-OCT) images, converted binary images and fundus photographs before, and 1 and 52 weeks after corticosteroid treatment from the right eye of a 40-year-old woman with Vogt–Koyanagi–Harada disease. She did not have chronic recurrences. EDI-OCT images through the fovea were converted to binary images using ImageJ software. (A) EDI-OCT image before treatment shows that chorioscleral border is unclear, which leads to an inability to binarise the images. (B) Fundus photograph 1 week after treatment. Black line indicates measurement of peripapillary atrophy (PPA) area. (C) Fundus photograph at 52 weeks after treatment. The increase in the PPA area at 52 weeks is defined as the PPA area at 1 week subtracted from the PPA area at 52 weeks. The second row (D–F) shows EDI-OCT images at 1 week after treatment, and bottom row (G–I) shows those at 52 weeks after treatment. (D and G) The luminal area (dark area) and the stromal area (light area) can be seen. The examined area was selected to be 1500 µm wide in the subfoveal choroid. The rectangle surrounded by a red line was selected, and the dark areas were traced by the Niblack method. (E and H) In the merged images of the binarised images and the margins of traced areas, the light pixels were defined as the stromal choroid and the dark pixels were defined as the luminal area. (F and I) Merged images of the original EDI-OCT images and the margins of traced areas show that the traced areas coincide with the dark choroidal areas of the original EDI-OCT image.

Enhanced depth imaging optical coherence tomographic (EDI-OCT) images, binary images and fundus photographs before, and 1 and 52 weeks after corticosteroid treatment from the right eye of a 50-year-old woman with Vogt–Koyanagi–Harada disease with chronic recurrences. (A) EDI-OCT image before treatment shows that detail choroidal structure is unclear, which leads to an inability to binarise the images. (B) Fundus photograph 1 week after treatment. Black line indicates area of peripapillary atrophy (PPA) measured. (C) Fundus photograph 52 weeks after treatment. Note the progression of PPA as compared with fundus photograph at 1 week (B). The second row (D–F) shows EDI-OCT images at 1 week after treatment, and bottom row (G–I) shows those at 52 weeks after treatment. (D and G) The rectangle surrounded by a red line was selected, and the dark areas were traced by the Niblack method. (E and H) The merged images of the binarised images and the margins of traced areas indicate relatively high ratio of luminal/stromal area as compared with the eye presented in figure 1. (F and I) Merged images of the original EDI-OCT images and the margins of traced areas.
Evaluation of peripapillary atrophy
Fundus photographs taken at 1, 4 and 52 weeks after the beginning of the high-dose corticosteroid treatment were used to evaluate the progression of peripapillary atrophy (PPA). The PPA area was measured using the software of the imaging system (PDT/MPS Software; Topcon, Tokyo, Japan) (figures 1 and 2). The size of the chorioretinal atrophy including the disc area was measured as the PPA area in the images.3 An increase in the PPA area at 4 or 52 weeks was defined as the PPA area at 1 week subtracted from the PPA area at 4 or 52 weeks.
Evaluation of chronic recurrences and sunset glow fundus
Chronic recurrences were defined as three or more recurrences of inflammations during a 52 weeks period and required continuous corticosteroid treatment. An increase in the dose of corticosteroid was determined based on the clinical findings such as recurrences of serous retinal detachment, exacerbation of iritis, iris nodules and keratic precipitates or choroidal rethickening on the EDI-OCT images. According to the fundus colour photographs at 52 weeks, the 34 eyes were classified into sunset glow fundus (+) and (−) groups.3
Statistical analyses
In this study, choroidal parameters of both eyes from each patient were obtained and used for statistical analyses. Thus, we used generalised estimating equations (GEEs) to revise the data clustering and dependency.14–16 In the GEE, we assessed changes in the time series for choroidal parameters among the following factors: subject effect and within-subject effects (‘the left or right eye’ and ‘time series’). In this estimation, the link function was set at identity link, and an exchangeable working correction matrix was used. Comparison of parameters between the two measurement points was performed using the Bonferroni correction. We also assessed the association of each choroidal parameter for PPA, dose of corticosteroid, sunset glow fundus and chronic recurrences among the following factors: subject effect, within-subject effects (the left or right eye) and each choroidal parameter. In this estimation, an independent working correction matrix was used, and the link function was set at identity link for PPA and dose of corticosteroid and logit link for sunset glow fundus and chronic recurrences. All analyses were done with the SPSS V.22.0 (IBM Japan, Japan). A p value of <0.05 was considered statistically significant.
Results
All patients were diagnosed with the incomplete type of VKH disease by the Revised Diagnostic Criteria.13 Based on the clinical response to the initial corticosteroid treatment, 15 patients received one pulse and two patients received two pulses of intravenous methylprednisolone. There was no case in which corticosteroid treatment was reinitiated during 52 weeks for the recurrence after corticosteroid discontinuation. With respect to repeatability of measurement of the stromal and luminal areas, the intrarater agreement was very high with an ICC of 0.996 (95% CI 0.994 to 0.997) for both the stromal and luminal areas.
Changes of subfoveal choroidal structure after treatment
Binarisation of the EDI-OCT images could not be performed on the images recorded before the treatment in 28 of the 34 eyes because a detailed structure of the choroid or a chorioscleral border was not evident in the EDI-OCT images (figures 1 and 2). At 1 week after initiating treatment, a detailed structure of the choroid and a chorioscleral border could be detected in all of the eyes. The changes in the subfoveal choroidal area in the binarised EDI-OCT images after treatment are shown in figure 3. The luminal, stromal and total choroidal areas significantly fluctuated over time (all p<0.0005), and were significantly decreased during the follow-up period (all p<0.05).
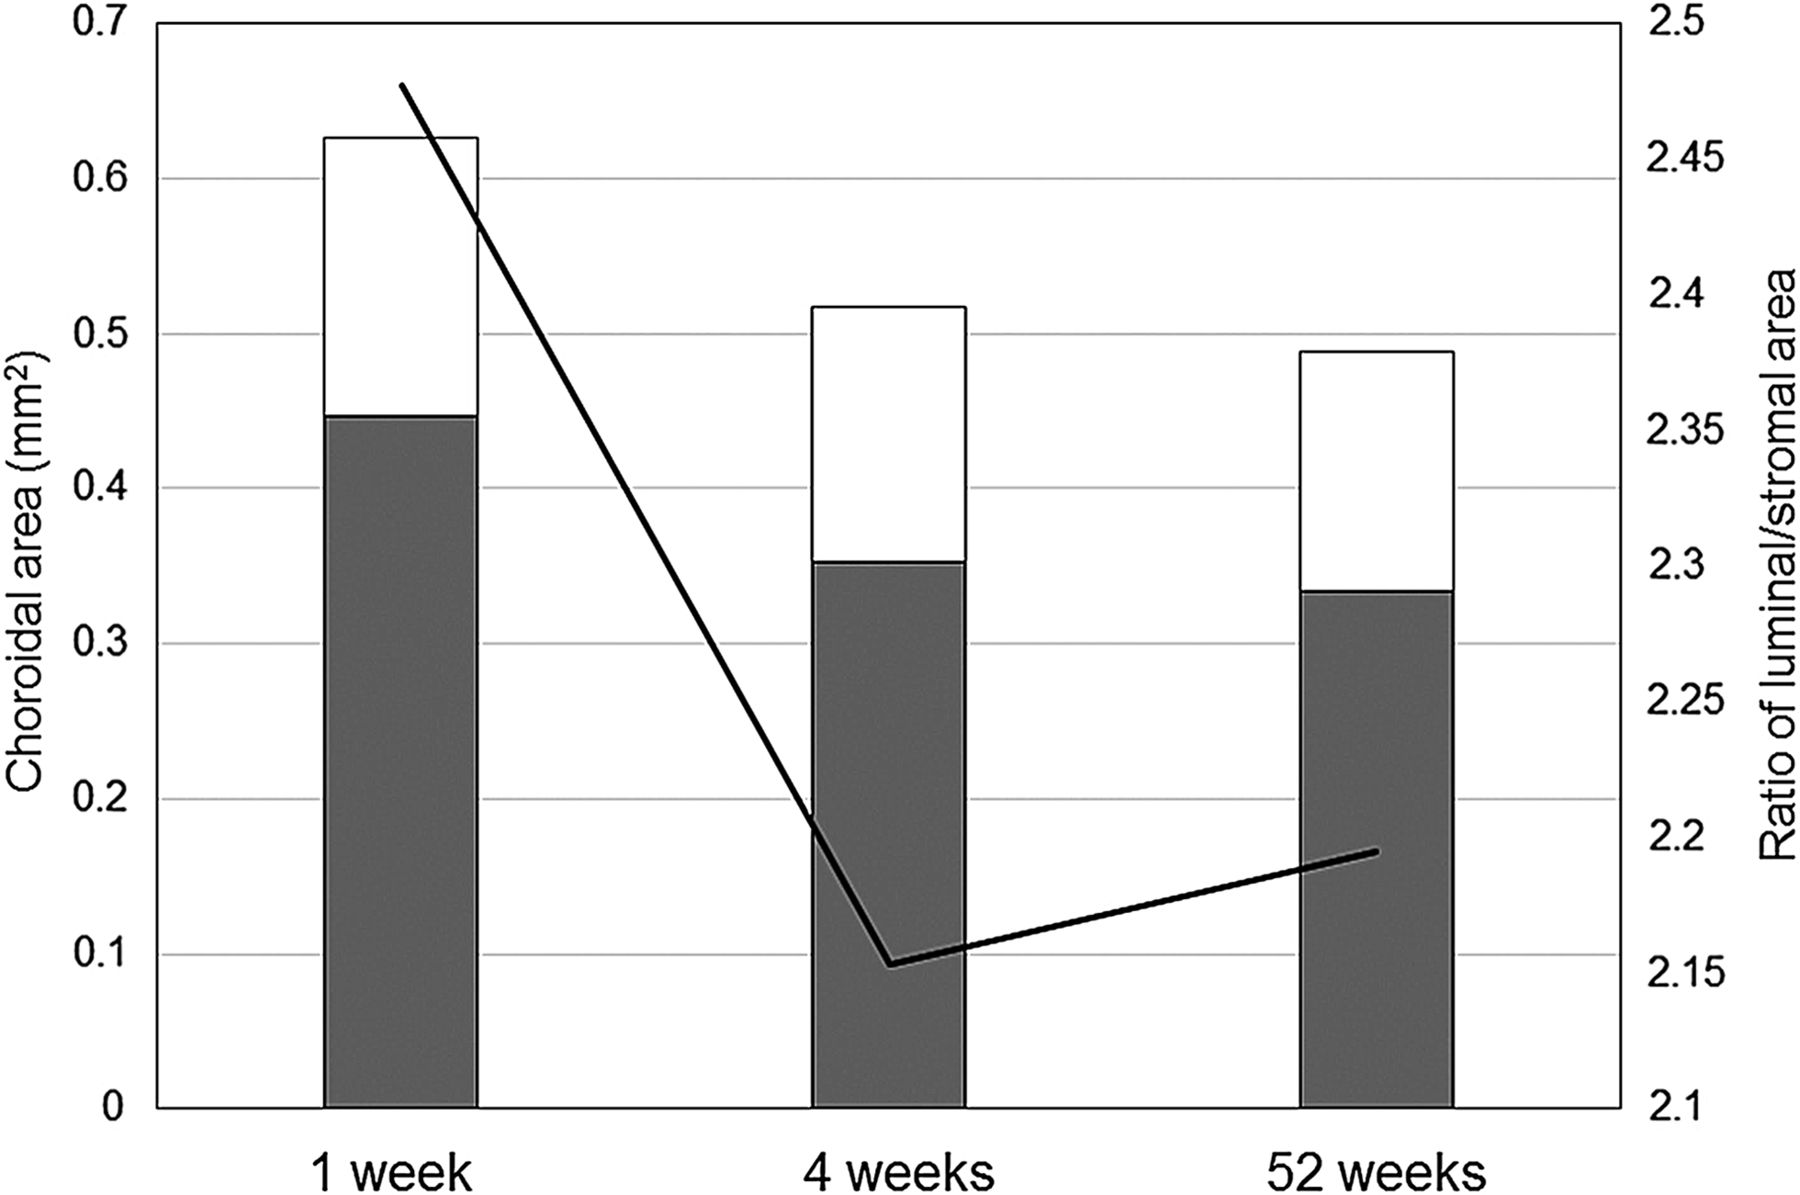
Changes of subfoveal choroidal area determined in the enhanced depth imaging optical coherence tomographic images after treatment. White bar, grey bar and line graph indicate stromal area, luminal area and ratio of luminal/stromal area (L/S ratio), respectively. After treatment, the L/S ratio and the luminal, stromal and total choroidal areas significantly fluctuated over time (all p<0.05). The luminal, stromal and total choroidal areas were significantly decreased during the follow-up period (1 week vs 4 weeks, 1 week vs 52 weeks, 4 weeks vs 52 weeks, all p<0.05). The L/S ratio was significantly lower at 4 weeks than at 1 week (p=0.0158). There was a tendency towards lower L/S ratio at 52 weeks as compared with the ratio at 1 week (p=0.0760). The L/S ratio was not significantly different between 4 weeks and 52 weeks (p>0.9999).
The ratio of luminal/stromal area (L/S ratio) was 2.477±0.083 at 1 week, 2.153±0.066 at 4 weeks and 2.195±0.071 at 52 weeks (mean±SEM). The L/S ratio significantly fluctuated over time (p=0.0201), and was significantly lower at 4 weeks than at 1 week (p=0.0158). The L/S ratio at 1 week was significantly higher than that of normal control eyes (1.984±0.074, p=0.0001), but the L/S ratio at 4 and 52 weeks was not significantly different from that of controls (p=0.3058, p=0.2012, respectively).
Correlation between subfoveal choroidal structure and PPA or steroid content
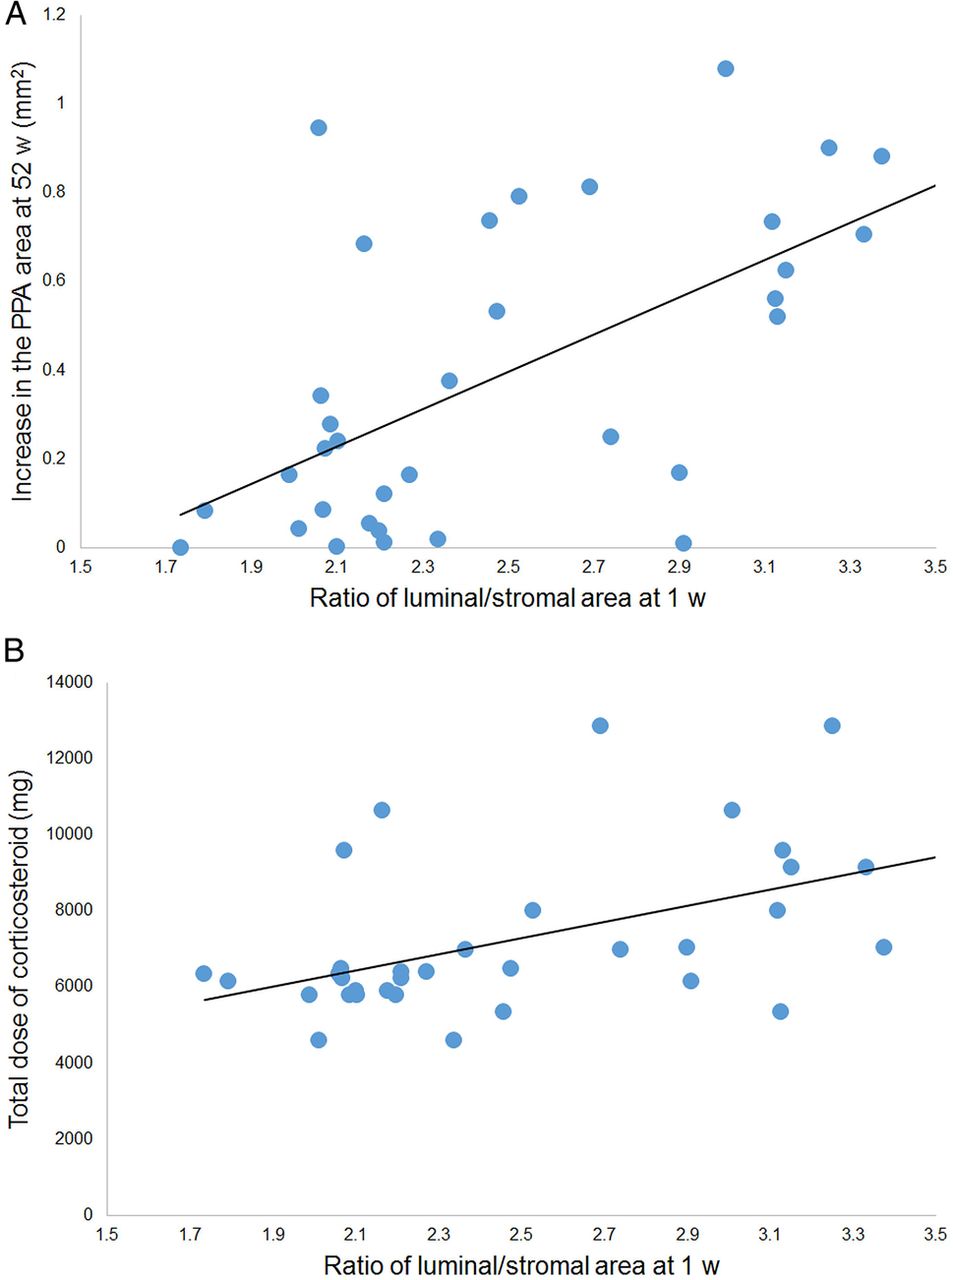
The luminal area and the L/S ratio at 1 week were significantly correlated with the increase of the PPA area at 52 weeks (Wald χ2=4.67, p=0.0306; Wald χ2=38.46, p<0.0001; respectively; table 1 and figure 4A). The luminal area and the L/S ratio at 1 week were also significantly correlated with the increase of the PPA area at 4 weeks (Wald χ2=4.64, p=0.0313; Wald χ2=6.24, p=0.0125; respectively).
Correlation between PPA, steroid content or chronic recurrence and subfoveal choroidal structure at 1 week after treatment

Correlation between the ratio of luminal/stromal area (L/S ratio) at 1 week and the increase in the area of the peripapillary atrophy (PPA) or the total dose of corticosteroid. (A). Correlation between the L/S ratio at 1 week and the increase in the PPA area at 52 weeks. The L/S ratio at 1 week was significantly correlated with the increase in the PPA area (Wald χ2=38.46, p<0.0001). The increase in the PPA area at 52 weeks is defined as the PPA area at 1 week subtracted from the PPA area at 52 weeks. The solid line represents the linear regression line (y=0.421x−0.656). (B) Correlation between the L/S ratio at 1 week and the total dose of intravenously or orally administered corticosteroid during 52 weeks (prednisolone equivalent). The L/S ratio at 1 week was significantly correlated with the total dose of corticosteroid (Wald χ2=8.41, p=0.0037). The solid line represents the linear regression line (y=2124.35x+1990.902).
The L/S ratio at 1 week was significantly correlated with the total dose of corticosteroid during 52 weeks (Wald χ2=8.41, p=0.0037; table 1 and figure 4B).
Correlation between subfoveal choroidal structure and chronic recurrences or sunset glow fundus
The L/S ratio at 1 week was significantly correlated with chronic recurrences (OR (95% CI)=1.37 (1.15 to 1.65), p=0.0006; table 1). There were no significant differences in age, sex and refractive error between in eyes with chronic recurrences and those without (all p>0.05). At the time of recurrence, the visual acuity decreased by two or more lines in 2 of the 10 eyes with recurrence, and the intraocular pressure was normal in all 10 eyes. The presence of chronic recurrences was significantly correlated with the increase of the PPA area at 52 weeks and total dose of corticosteroid (Wald χ2=11.90, p=0.0006; Wald χ2=17.47, p<0.0001; respectively), but not with the presence of sunset glow fundus at 52 weeks (p=0.1028).
The sunset glow fundus was found in 8 of the 10 eyes with chronic recurrence. The L/S ratio at 1 week was not significantly correlated with the presence of sunset glow fundus at 52 weeks (p=0.8422).
Discussion
EDI-OCT has allowed clinicians to examine the choroidal thickness in eyes with various pathologies including VKH disease. Because the choroid does not have a well-organised architecture like the retina, it is difficult to detect morphological changes in the EDI-OCT images. Therefore, we used the binarisation technique to differentiate and quantify the luminal and the stromal areas.10–12 Using a publicly accessible ImageJ software, Sonoda et al10 showed that the luminal and stromal areas could be differentiated and quantified with high repeatability and reproducibility. Being consistent with this result, the intrarater agreement was very high with an ICC of 0.996 for measurement of the stromal and luminal areas in the present study. There have been studies that assessed the vascular structure of the normal choroid in the OCT images, but the methods used required custom-made software which limited their general use.17 ,18
In normal subjects, Sonoda et al10 reported that the mean L/S ratio was 1.921, which was similar to that of the control eyes in the present study. In eyes with VKH disease, the L/S ratio was significantly higher at 1 week as compared with the normal control eyes. These results indicate that the choroidal vessel had probably become more dilated than the interstitial choroidal tissue suggesting a choroidal vasculitis. This is supported by a histopathological study that showed an infiltration of polymorphonuclear neutrophils and macrophages into the thickened choroid accompanied by oedema and vascular dilatation during the active phase of VKH inflammation.4 ,19–21
The most useful finding for the management of VKH disease in this study was that the L/S ratio at 1 week was significantly correlated with subsequent chronic recurrences and total dose of corticosteroid. The L/S ratio at 1 week was predictive factor for the subsequent chronic recurrences and total dose of corticosteroid. Nakai et al19 reported that the choroidal thickness decreased over time after treatment for VKH disease, but the choroidal thickness increased markedly again at the time of exacerbation. These results suggest that dilatation of the choroidal vessels or choroidal vasculitis might be associated with the recurrences. The present study indicated that the L/S ratio measured by binarisation of the EDI-OCT images could serve as a marker for subsequent chronic recurrences in VKH disease.
In the present study, a high L/S ratio at 1 week after treatment was statistically correlated with the progression of the PPA. Although it remains unclear exactly why VKH patients with high L/S ratio develop PPA, our findings suggest that a greater severity of the initial choroidal vasculitis that causes more dilatation of choroidal vessels, leads to more tissue destruction in the active phase and consequently greater tissue atrophy such as PPA in the convalescent phase. Takahashi et al3 evaluated the subfoveal choroidal thickness at the convalescent stage of VKH disease with the disease duration of >3 years. They reported that the choroidal thickness was inversely correlated with the disease duration and the PPA size, although their study was cross-sectional study. The authors concluded that a thinner choroid and larger PPA areas were correlated with the disease duration and might be caused by latent choroidal inflammation in the convalescent stage.
This study has limitations. We studied only 34 eyes with VKH disease, and further studies examining a larger number of cases treated for VKH disease will be needed. In addition, we did not have baseline values of the choroidal parameters. Another limitation is that the follow-up period of 1 year may not be long enough. In addition, further studies examining whether the L/S ratio may increase again with exacerbation of VKH disease will be necessary.
In conclusion, binarisation of the EDI-OCT images may be a useful and non-invasive method to evaluate the choroid after treatment for VKH disease. After treatment, the luminal, stromal and total choroidal areas were significantly decreased. The L/S ratio at 1 week was predictive factor for the progression of PPA, subsequent chronic recurrences and total dose of corticosteroid. The L/S ratio measured by binarisation of EDI-OCT images may serve as a marker for degree of choroidal inflammation in the VKH disease. We believe that binarisation of EDI-OCT images of the choroid will greatly help in assessing the choroidal inflammation in the VKH disease.
Acknowledgments
The authors thank Professor Emeritus Duco Hamasaki of the Bascom Palmer Eye Institute of the University of Miami for providing critical discussions and suggestions for our study and revision of the final manuscript.
References
Footnotes
Contributors All authors have given final approval of this version to be published. Design of the study (YM, SS and TS), conduct of the study and management of the data (ME, KA, KS and TK), analysis of the data (ME, YM, KA, KS, TK, EU and SS), interpretation of the data (ME, YM, EU, SS and TS), preparation of the manuscript (ME and YM) and overall coordination (TS).
Funding This work was supported in part by grant-in-aid 25462717 (to YM) from the Ministry of Education, Science, Sports and Culture, Japan.
Competing interests None declared.
Patient consent Obtained.
Ethics approval The Institutional Review Board of Tokushima University Hospital.
Provenance and peer review Not commissioned; externally peer reviewed.
Data sharing statement Data are available from the corresponding author upon request.
Linked Articles
- At a glance