Article Text

Statistics from Altmetric.com
Reference to inequalities in health has been made in the past—for example, by William Farr in the 19th century.1Although significant improvements in health have taken place in many parts of the world over the last century, major inequalities in health continue to persist among various population groups.2 3The socioeconomically disadvantaged regions of the world experience higher mortality and disability rates, which are the highest in sub-Saharan Africa and lowest in the established market economies.4 There is evidence that these inequalities also exist within the developed countries5-7 as well as within the developing countries.8 9
Globally there is increasing concern for the health of the poor and for reduction in health inequalities.2 3 Inequalities refer to relative health status. In simple terms, this is a measure of how worse off the disadvantaged group is relative to the advantaged group.2 Health inequalities can be assessed by two different aspects of health—the health status and the health service use and financing.3 The traditional approach for assessing inequalities in health status has been based on income or economic standing. In addition, education and occupation have also been used to assess the differences in health status as a proxy for economic status. However, the economic dimension is not the only one that influences health inequalities. The other important dimensions are sex, ethnic, and regional inequalities. The other aspects of health inequalities, health service use and financing, measure the inequality in the use of and spending on health services between various population groups.
This review presents a summary of the data available regarding inequalities in the prevalence and causes of blindness between various socioeconomic groups. A literature review was carried out for surveys published in 1990 or later to assess the following: (i) variations in the prevalence and causes of blindness between countries with different economic standing and variations within countries, and (ii) social, economic, and demographic variables affecting blindness. The literature search revealed that the association of socioeconomic variables in the context of blindness had been reported in surveys of the prevalence and causes of blindness and in surveys related to the prevalence and visual outcome of cataract surgery. The most commonly assessed socioeconomic variables in these surveys were income, education, sex, and ethnicity/race.
Prevalence of blindness
REGION AND BLINDNESS
Global data on the prevalence of blindness indicate that the developing countries in sub-Saharan Africa, India, and other Asian countries have a higher share of the burden of blindness when compared with the established market economies, the former socialist economies of Europe, and Latin America.10-12 Nearly two thirds of the global burden of blindness is in India, China, and Africa.10-12 The estimated prevalence of blindness globally in the years 1990 and 2000 by region are shown in Figures 1and 2. These data highlight that the burden of blindness remains quite high in many developing countries compared with the developed countries.
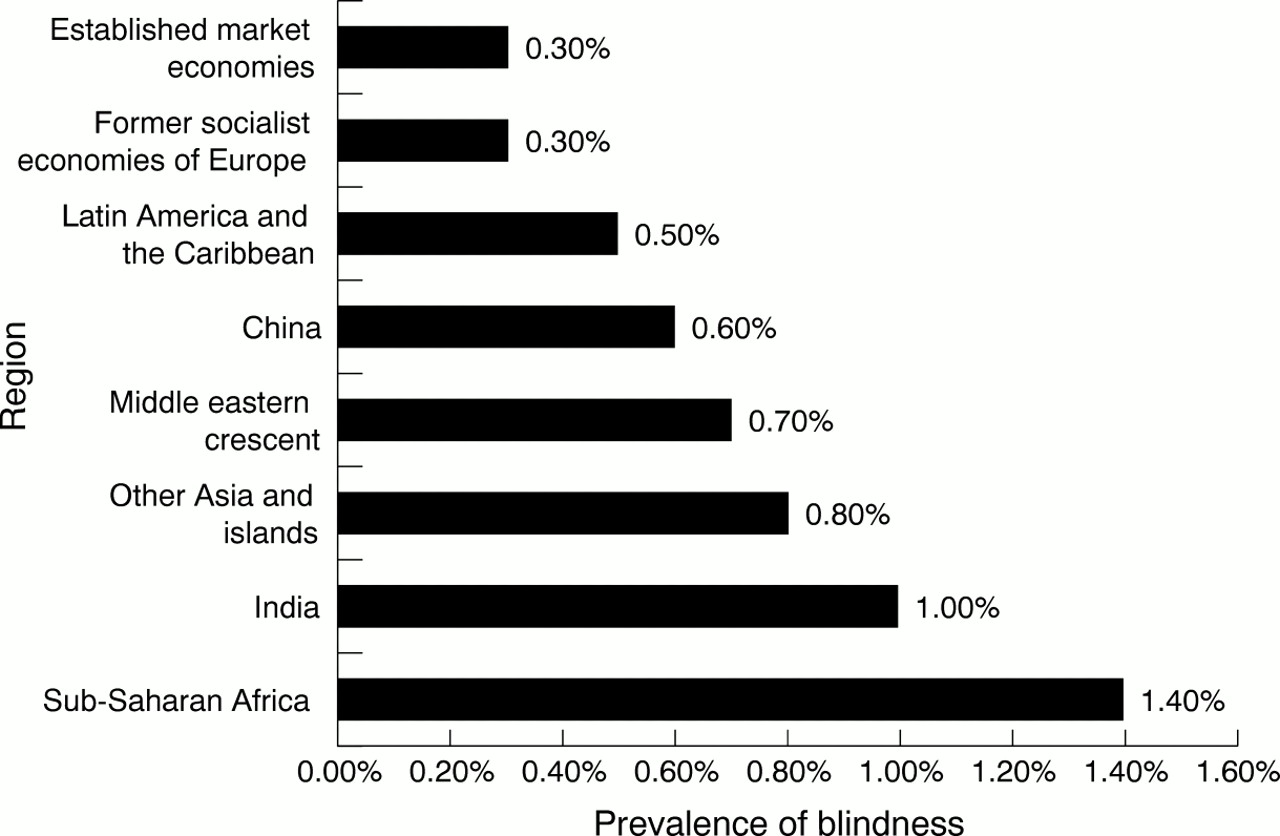
The estimated prevalence of blindness globally in the year 1990 by region.10 Blindness was defined as best corrected visual acuity <3/60 in the better eye.

The estimated prevalence of blindness globally in the year 2000 by region.12 Blindness was defined as presenting visual acuity <3/60 in the better eye.
A recent review of the relation between the prevalence of blindness and economic development indicates a trend of higher prevalence of blindness in developing countries with lower per capita income.13 In other words, an inverse association was seen between the blindness rate and the economic status of each region.
In addition to the variation in the prevalence of blindness between the countries, recent data from India suggest that there are also variations in the prevalence of blindness between the urban and rural areas of a country. In the southern Indian state of Andhra Pradesh, the prevalence of blindness (presenting visual acuity <6/60 or central visual field <20 degrees in the better eye) for all age groups combined was estimated as 1.36% for the urban area of the state compared with 2.03% for the rural areas (underserved) of the state.14 Similarly, in a study done in the northern Indian state of Rajasthan,15 the prevalence of blindness (presenting visual acuity <6/60 in the better eye) for those 50 years of age or more was estimated as 6.7% for the urban area and 12.8% for the rural areas of the state.
Even though limited data are available on the prevalence of childhood blindness in developing countries, it is suggested that the prevalence of blindness in children is higher in countries with high under 5 mortality rates.16 17 It is suggested that there may be a 10-fold difference in the prevalence of childhood blindness (best corrected visual acuity <3/60 in the better eye) between the wealthiest countries of the world and the poorest, ranging from as low as 0.1/1000 children (⩽15 years of age) in the wealthiest countries to 1.1/1000 children in the poorest countries.16
INCOME AND BLINDNESS
The Andhra Pradesh Eye Disease Study from India reported that the odds of having blindness (presenting visual acuity <6/60 or central visual field <20 degrees in the better eye) increased with decreasing monthly per capita income.14 Those belonging to extreme lower (monthly per capita income ⩽US$4.5) and lower (monthly per capita income ⩽US$11.3) socioeconomic strata had 10 and five times higher risk of having blindness, respectively, compared with those belonging to the upper socioeconomic status (monthly per capita income >US$45.5), using multivariate analysis.14 Similar results were reported from a study of blindness in older adults from three communities in the United States.18 Those belonging to the higher income category were 30% less likely to have functional blindness (presenting visual acuity <6/60 in the better eye) compared with those belonging to the lower income category. The results from the Beaver Dam Study suggested that those with higher income were 30% less likely to have blindness (best corrected visual acuity ⩽6/60 in the better eye) though this was not statistically significant.19
EDUCATION AND BLINDNESS
Education, in terms of years of schooling, has also been assessed as an independent predictor for the risk of blindness, often as a surrogate measure for economic status. Around three times higher risk of blindness has been reported in those with no schooling compared with those with schooling in studies from India,15China,20 and Nepal.21 For example, in the study on those ⩾50 years of age in the Indian state of Rajasthan, the prevalence of blindness (presenting visual acuity <6/60 in the better eye) in those with no schooling was 14.7% compared with 3.8% in those with any level of schooling.15 A suggestion of decrease in the prevalence of blindness (best corrected visual acuity ⩽6/60 in the better eye) with increasing level of education has been reported from the Baltimore Eye Survey22 and the Beaver Dam Eye Study.19 The prevalence of blindness in those with no schooling or <7 years of schooling was reported as 1.87% compared with 0.84% in those with >12 years of schooling in the Baltimore Eye Survey.22
SEX AND BLINDNESS
A consideration of sex in the analysis of inequalities in health is important, as females commonly suffer social and economic vulnerability in many societies worldwide, which contributes to inequalities in health and access to health care.23
Recently a meta-analysis of the published population based surveys was conducted to assess the burden of blindness by sex.24 This meta-analysis reported that the age adjusted odds of blindness in females were higher than in males in all parts of the world—39% higher in Africa, 41% higher in Asia, and 63% higher in the industrialised countries. On considering data from all the countries together, the analysis revealed that females accounted for 64.5% of the blind population in the world.
ETHNICITY AND BLINDNESS
The prevalence of blindness has been reported to be high in the populations of Asian-Indian origin14 15 and African origin.25 26 A higher prevalence of legal blindness (best corrected visual acuity ⩽6/60 in the better eye) among those 40 years of age or older has been reported in the black population (1.75%) compared with the white population (0.76%) in the Baltimore Eye Survey from the United States.27
Causes of blindness
REGION AND CAUSES OF BLINDNESS
Global data on blindness suggest that cataract, refractive error, and trachoma are the most important causes of blindness in developing countries whereas age related macular degeneration is the most common cause in established market economies.10-12 This suggests that the prevalence of blindness due to avoidable causes is higher in the countries with poor socioeconomic status.
The causes of blindness for all age groups from some recent population based studies in developing countries are shown in Table 1. These data suggest that the causes within developing countries also vary considerably. The prevalence of cataract blindness (visual acuity <3/60 in the better eye) is reported to be 0.18% in China,28 0.25% in Lebanon,29 0.61% in India,14 and 1.17% in Mali.25 In Africa, trachoma as a cause of blindness was seen in Mali25 and the Central African Republic26 but not in South Africa.30 This is probably related to the relatively higher socioeconomic status of South Africa compared with the other two countries, as trachoma is known to be more prevalent in the poor communities.31-34
Causes of blindness from some recent population based studies of all age groups in developing countries
There is a marked variation in the major causes of blindness in children in different parts of the world.16 17 In the poor countries of the world, corneal scarring due to vitamin A deficiency, measles, ophthalmia neonatorum, and use of harmful traditional eye practices dominate, all of which are preventable causes of blindness, whereas in the high income countries, the commonest causes of childhood blindness are central nervous system disorders and retinal conditions, which are currently not preventable.17
INCOME AND CAUSES OF BLINDNESS
Cataract blindness has been reported to be higher in the lower income groups in the Indian state of Andhra Pradesh.14Trachoma has been reported to be a cause of blindness in the Aboriginal population of Australia,34 which has a lower socioeconomic status, but not in the non-Aboriginal population of Australia.35
Variation in blindness due to vitamin A deficiency has been reported within a country from a study of children in blind schools in nine states of India.36 The proportion of blindness due to vitamin A deficiency was reported as 7.5% in Kerala, a state with higher socioeconomic status compared with 26.7% in a relatively poor state of Madhya Pradesh.36
Apart from the association of socioeconomic status with causes of blindness itself, some studies have found an association of socioeconomic status with the prevalence of eye diseases that can potentially lead to blindness. Examples of these eye diseases are trachoma, vitamin A deficiency, and diabetic retinopathy. Trachoma has always been associated with poverty, poor sanitation, and low socioeconomic status.33 In Nepal, lower socioeconomic status was identified as a risk factor for trachoma.32 A study done in a rural village in the Gambia reported a dramatic fall in the occurrence of trachoma with improvements in sanitation, water supply, education, and access to health care in the village.31 Trachoma has been reported to be common in the Australian Aboriginal population, which has low socioeconomic status.34 Malnourished children, especially in the poor families, are more likely to have vitamin A deficiency.37The Wisconsin Epidemiologic Study of Diabetic Retinopathy suggested that less education was associated with the development of loss of vision independent of other factors.38 However, consistent associations have not been found in the relation of socioeconomic factors with diabetic retinopathy.39-42
SEX AND CAUSES OF BLINDNESS
Trachoma is more common in the marginalised, impoverished, and those with low socioeconomic status.24 37 Females have been reported to have a higher risk of trachoma and related blindness.24 37 43 44 This is probably related to the lower status of the females in the society, their spending more time with children who are the main source of active infection, exposure through poor environmental sanitation, and household environment, and less access to surgery for trichiasis.24 37 The prevalence of blindness due to cataract has also been reported to be higher in females compared with males in studies from India and Africa.14 24 The reasons for this may include a possibly higher susceptibility of females to cataract or to underutilisation of cataract services by females.14 24 45-47 However, blindness from onchocerciasis has been reported to be higher in males.26
ETHNICITY AND CAUSES OF BLINDNESS
Difference in the causes of blindness by ethnicity could be related to inherent predisposition to the disease itself or because of difference in access to eye care services, which in turn could be due to lower socioeconomic status. Blindness due to cataract was four times higher in black people compared with white people in the Baltimore Eye Survey in the United States, suggesting that operable cataracts were treated inadequately among the black people compared with white people.48 Blindness due to primary open angle glaucoma was reported to be six times higher in black people compared with white people in Baltimore.48 In a study of Medicare beneficiaries in the United States, black people were half as likely to be surgically treated for glaucoma compared with white people.49
Cataract surgery
PREVALENCE
In the Indian state of Andhra Pradesh, it was reported that 1.34% and 1.27% of the population in the urban and “well off” rural area of the state, respectively, had blindness prevented as a result of cataract surgery as compared with 0.46% and 0.72% in two “poor” rural areas of the state.14
A study done in Mali, Africa, suggested that males were more likely to have undergone cataract surgery compared with females.50
In the Baltimore Eye Survey, a history of cataract surgery was 43% more common among white people 50–79 years of age than among black people of the same age.48 In the Beaver Dam Eye Study, a “U-shaped” relation was found between total household income and cataract surgery, suggesting that those with lower and higher income were more likely to have undergone cataract surgery compared with the middle income group.19 The reasons for this are not fully clear though the authors suggest that this could be related to better access to health insurance, as many of these people were still working.
VISUAL OUTCOME
The majority of the available data related to visual outcome of cataract surgery are from the developing countries where cataract is the major cause of blindness. However, not many of these studies have directly explored the association of socioeconomic factors and the outcome of cataract surgery.
In the Andhra Pradesh Eye Disease Study in India, those with monthly per capita income of ⩽US$4.5 had five times higher risk of having very poor visual outcome (presenting visual acuity <6/60) after cataract surgery compared with those with monthly per capita income >US$4.5.51 In this study, females had a 2.5 times higher risk of having an adverse outcome after cataract surgery (presenting visual acuity <6/18).51 In a study in the Indian state of Rajasthan, a higher chance of poor visual outcome (presenting visual acuity <6/18) after cataract surgery was reported in females (74%) compared with males (62%), and those living in the rural areas (73%) compared with those living in the urban areas (52%).52
In the study from Mali, Africa males with formal schooling and higher social status were more likely to have undergone intracapsular cataract surgery compared with the tradition couching.50 Though the results with both procedures were unsatisfactory, the visual outcome after couching was worse than after intracapsular cataract surgery: 100% of the people after couching had presenting binocular visual acuity <6/60, whereas 65% of the people after intracapsular cataract surgery had this level of vision.50
Discussion
The relation between lower socioeconomic status and higher blindness rate is unambiguous. This is clearly indicated from the higher prevalence of blindness in the poorer countries of the world compared with the developed countries.10-13 In addition, data also suggest that within a particular country those with lower socioeconomic status are more likely to suffer from blindness, around the world.14 15 18-22 24 The contributions to this phenomenon seem to include higher prevalence of blinding conditions in those with lower socioeconomic status, less access to health services by those with lower socioeconomic status for the treatable and preventable causes of blindness, and poor quality of health services available to those with lower socioeconomic status.
A global initiative for the elimination of avoidable blindness was launched in February 1999 under the title “Vision 2020—the right to sight.”11 53 54 Vision 2020 was born out of a concern over the rapidly increasing burden of avoidable blindness globally, particularly in the developing countries. This global plan is expected to allow setting priorities, coordinating work, establishing new partnerships for advocacy, and mobilising resources. The eye conditions causing blindness that have currently been designated as priorities under Vision 2020 include cataract, trachoma, onchocerciasis, childhood blindness, and refractive errors.11 53 54
In order to set priorities to reduce blindness, it is important to identify the targets for these priorities. “Developing countries” is the most commonly talked about target for blindness control programmes. However, it is apparent that even within a country, significant variations in the magnitude of blindness exist among the various socioeconomic status groups. It would then seem prudent to set priorities based on these observed inequalities for the blindness scenario to be improved. Many studies around the world have identified the groups who are likely to have higher risk of blindness—those with lower monthly income, with no education, females, and ethnic minorities. In order to have effective strategies for reduction of blindness, it is imperative that the blindness control programmes actively target these groups in the populations.
The data on the inverse association of socioeconomic status and blindness from the developed world were mostly limited to the United States where black people, who have lower socioeconomic status, were identified to have a higher risk of having blindness compared with white people.22 Since the prevalence of blindness in the developed countries is low compared with the developing countries, it is not easy to assess the associations of socioeconomic status with blindness. However, when one considers a lesser degree of visual impairment (<6/18) for the developed countries, there is a significant inverse association between socioeconomic status and visual impairment.19 22 55 56
In conclusion, the available evidence quite clearly suggests an association between lower socioeconomic status and a higher rate of blindness. This applies to comparison between countries with different levels of average socioeconomic status, and to the different socioeconomic strata within particular countries. If avoidable blindness has to be eliminated, as proposed by the global initiative Vision 2020, the vulnerable groups belonging to lower socioeconomic strata would have to be effectively targeted.