Article Text

Statistics from Altmetric.com
Recently, Chauhan et al presented recommendations for measuring rates of visual field change in glaucoma.1 Unlike event detection, assessment of this “rate of progression” should permit the prediction of blindness occurring during lifetime and thus provide information on the need for treatment or its intensification.2 They emphasised the need for frequent perimetry in glaucoma and ended with recommending six fields in the first 2 years. However, although they stressed the importance of the assessment of the rate of progression (depicted by a mean deviation (MD) slope), their analyses actually addressed the question of how many fields are needed to detect a slope significantly different from zero, leaving unanswered the question of how accurately that slope can be determined. The aim of this letter is to address the latter question. For this purpose, model calculations were performed similar to that of Chauhan et al and as published before,1 3 using realistic estimates of rates of progression and variabilities as obtained from measured data.1 4 Series of fields were modelled using MD values; progression was modelled as a linear decay of MD and variability by adding noise to MD. A linear decay seems to be a valid approach,5 unless major changes in treatment intensity occur or very long follow-up durations are modelled.
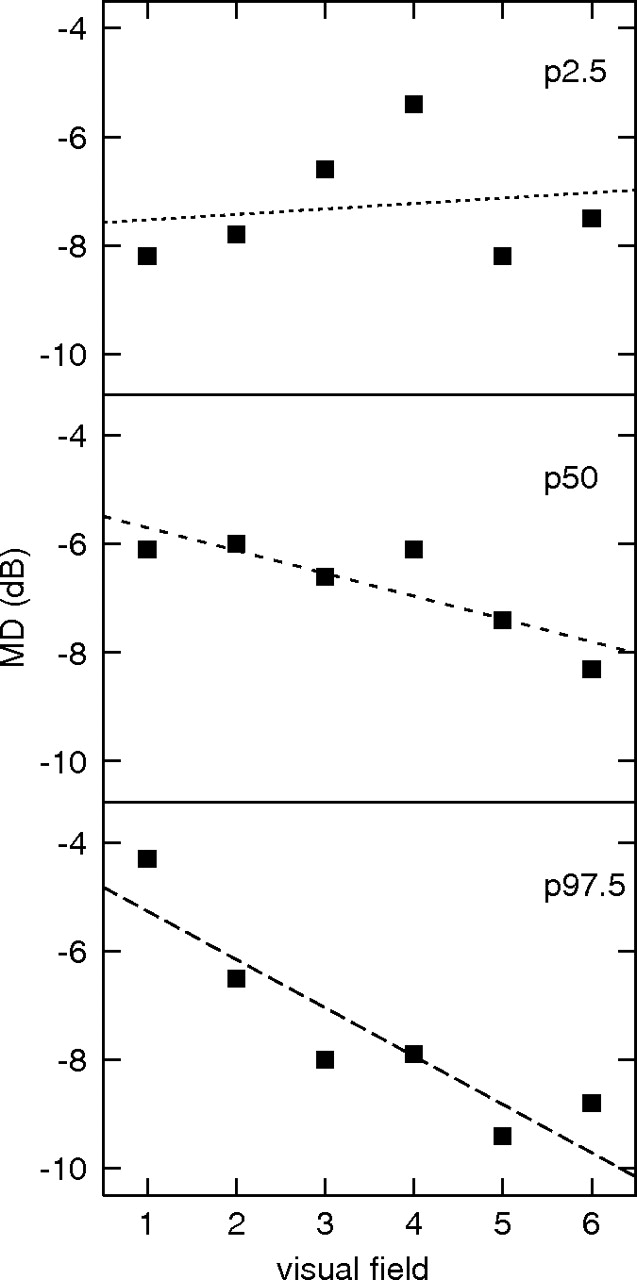
The observed MD slope may differ considerably from the real slope due to variability. This is illustrated in Figure 1. The message of this figure is that if someone would try to predict future loss after 10 years from an observation of six fields in 2 years in a patient with a real slope of −1 dB/year and a variability of 1 dB, anything between a 2-dB increase in MD (a clinically insignificant change) and a 22-dB decrease (bringing the patient close to blindness even with little baseline loss) could be predicted. Table 1 presents the mean observed slope and corresponding 95% central range (2.5th to 97.5th percentile) for several realistic combinations of real slopes and variabilities for six fields in 2 years (A), eight fields in 4 years (B) and 10 fields in 6 years (C). As can be seen in table 1A, the 95% central ranges in most cells amply overlap, illustrating the lack of accuracy of slope determination. Only with rapid progression and limited variability (the three cells in the lower left corner of table 1A) does the 95% central range not include 0 dB/year—corresponding to the ability to detect a slope significantly different from zero in these situations with six fields in 2 years. Table 1B,C shows that with a longer follow-up, some estimate of the slope becomes feasible even with a relatively lower number of fields. The explanation of this observation is that the ratio between the overall change and the variability increases with time.
Three examples of a series with six fields in 2 years with a real slope of −1 dB/year and a real variability of 1 dB. The observed examples correspond to the 2.5th percentile (P2.5), the median (P50) and the 97.5th percentile (P97.5) of the observed slopes.
Mean observed rate of progression with the corresponding 95% central range (2.5th to 97.5th percentile) in brackets as calculated for six visual fields performed in 2 years (A), eight fields in 4 years (B) and 10 fields in 6 years (C) as a function of the real rate of progression and variability (SD of the noise added to MD)
Rate of progression is a useful concept, but this rate cannot be determined with a reasonable number of tests within a period of about 5 years. Therefore, progression detection has to start with event detection. This can be performed with the six fields in 2 years approach,1 where a statistically significant slope should be interpreted as an event without paying too much attention to the slope itself. However, event detection can be performed more efficiently with an approach called adaptive testing.3 6 In this approach, the interval between subsequent tests depends on the previous test results, following simple Bayesian rules. This results in more fields in patients with progression compared to patients doing well, and the fields cluster at onset (building a baseline) and—if progression occurs—at the end of the follow-up (confirmatory tests) which makes the slope determination more accurate.
Footnotes
Funding University Medical Center Groningen.
Competing interests None.
Provenance and peer review Not commissioned; externally peer reviewed.