Article Text

Statistics from Altmetric.com
Editor—The prevalence of myopia varies widely.1-3 In western Europe and the United States the prevalence of myopia is estimated as 10-25%, while in parts of Asia the prevalence is often much higher.4-9 High myopia (usually defined as a refractive error ⩾−6.00 D) has a prevalence of 0.5-2.5% in western Europe and the USA and is second only to diabetes as the most common cause of blindness in the working age population.2 10 11 Here, to distinguish it from high myopia, myopia <−6.00 D will be referred to as “low myopia”.
There is compelling evidence that both environmental and genetic factors are involved in the aetiology of myopia.12 An influential series of population studies by Younget al 13 14 reported a dramatic increase in the prevalence of myopia in the generation of Alaskan Eskimos first exposed to compulsory education and a “westernised” environment during their childhood. Independent population studies targeting other isolated communities that had been exposed to similar changes in environment corroborated these findings15 16Parent-offspring heritability estimates in these studies were generally low (table 1), while sib-sib heritability was usually high, suggesting that environmental factors had dominated any influence of genetics in determining refractive error. Dominance of environmental factors over genetic factors is also evident in “form deprivation” myopia. This condition develops when visual clarity is severely compromised during a critical period of postnatal development.17-20
Heritability estimates for myopia from family studies
The genetic contribution towards the development of myopia has been investigated in both population studies (table 1) and twin studies (table 2), and has been reviewed previously.12 21 While these investigations have suggested that myopia is genetically determined to some extent, there has been no consensus of opinion regarding whether or not myopia has different aetiological causes, nor on the mode or modes of inheritance of the disease. Nevertheless, the reviews of Bear12 and Goss et al 21 suggest that myopia is likely to be aetiologically heterogeneous and that, in the case of high myopia, both polygenic and various monogenic forms of inheritance may be involved.
Heritability estimates for myopia from twin studies
In the last decade, the molecular genetics of myopia has begun to be explored, and these investigations have increased our understanding of myopia considerably. Early studies in this area identified the myopias that occur as part of the rare connective tissue diseases Marfan syndrome and Stickler syndrome types 1 and 2, tracing the conditions to defects in the fibrillin, COL2A1, andCOL11A1 genes, respectively.22-24 In addition, the loci of the X linked Åland Island eye disease and the autosomal recessive Knobloch syndrome were mapped to Xp11 and 21q22.3, respectively.25 26 In the case of simple myopia (myopia that occurs in the absence of other abnormalities), Olmedo et al 27and Pintado et al 28 were the first to provide evidence for genetic differences between high and low forms. More recently, genetic linkage studies have identified two discrete loci for dominantly inherited simple high myopia.29 30 The latter work has confirmed the aetiologically heterologous nature of simple high myopia for the first time.
While there has been numerous attempts to estimate the heritability of myopia (tables 1 and 2), none of these studies has calculated a heritability estimate solely for high myopia. Given the likelihood of aetiological differences between high and low myopia, we sought to calculate such a heritability estimate. In view of the probable polygenic nature of most high myopia,21 we also calculated a risk ratio for sibs (λs) for high myopia. In both cases, these calculations were based on a reanalysis of the data of Goldschmidt.5
Methods. The 1968 study by the Danish geneticist Ernst Goldschmidt5 is particularly informative because the population groups investigated were large and chosen without bias. One of the two samples studied by Goldschmidt was the population of children born in Copenhagen in 1948. At the time of examination, these children were aged 13 to 14 years. The size of the population group was estimated to be 9700, and 9243 of these were surveyed (95%). The school medical records of the 9243 children were screened to identify those likely to be myopic (specifically those already wearing spectacles or with reduced visual acuity). Since all children in the population group were examined by a school medical officer on an annual basis, it seems unlikely that any cases of high myopia would have been missed. Subjective refraction was measured in sphere/cylinder form for 1039 of the 1111 children identified as potential myopes (for the 72 potential myopes who were not examined, Goldschmidt predicted that 62 were myopic based on their medical records). Cycloplegia was only used “where the indications were uncertain or there was an obvious discrepancy between the uncorrected and corrected vision”. Myopes with an ocular refraction in one eye of ⩽−6.00 D were classified by Goldschmidt as high myopes, and the ocular refractions of their parents and sibs were also measured and reported.
Goldschmidt calculated the prevalence of myopia in his child population group to be 9.5%. However, for subsequent analyses regarding the different degrees of myopia, he confined his analysis to numbers of affected eyes rather than the number of affected people. Since the latter figure is required for calculations of a risk ratio for high myopia (see below), we have reanalysed Goldschmidt's data in order to estimate the prevalence of highly myopic subjects, as follows. Of the 9243 children screened by Goldschmidt, 877 were myopic. In a subset of 815 of these myopes (see above), 39 were myopic by ⩽−6.00 D in at least one eye. Thus the prevalence of high myopia was calculated as (39/9243) × (877/815) = 0.45%.
The second population group studied by Goldschmidt5consisted of Danish military conscripts. However, instead of quoting the prevalence of high myopia for this population, he reported the prevalence of myopia >−6.50 D. Thus, to enable comparison with this latter group, we have calculated the prevalence of myopia >−6.50 D for the boys in Goldschmidt's population of 9243 children. Making the assumption that 50% of the children were male, the prevalence was (2 × 12/9243) × (877/815) = 0.28%. This assumption seems valid since Goldschmidt reported that exactly 50% of the 8981 children attending “normal” schools were male.
We calculated the heritability of high myopia from the family data for highly myopic children identified by Goldschmidt,5 using the method described by Falconer31 and Vogel and Motulsky,32 where heritability is defined as the ratio of additive genetic variance (V A) to phenotypic variance (V P). Briefly, midparent-offspring heritability was calculated as h = (r/0.5) where r was the correlation between midparent versus offspring ocular refractions. As suggested,31 offspring data were averaged for each family analysed. Sib-sib heritability was calculated ash2 = 2r where r was the correlation between probands and the mean of the other sibs. Probands were included in the analysis since they were derived from a sample which was considered unselected. The 95% confidence intervals of the correlation were calculated and the null hypothesis of zero correlation was tested, as described by Altman.33 To avoid a source of potential bias, right and left eyes were analysed independently, since ocular refractions were highly correlated between the two eyes of subjects.5
The risk ratio for sibs (λs) for high myopia was calculated for Goldschmidt's child population according to the formula λs = risk to sibs of affected probands/population prevalence, as described.34 The population prevalence of high myopia for this group of children was taken as 0.45%.
It was not possible to calculate a risk ratio for sibs (λs) for low myopia from Goldschmidt's study group because family data were only available for the highly myopic children. In fact the only previous study that reported sufficient data to enable such a calculation was that of Sperduto et al. 35 This contained refractive data for a representative cross section of North American families. Unfortunately, however, the population group studied by Sperdutoet al 35 was separated both in time (one and a half generations) and geography (Denmark versus the United States) from the population studied by Goldschmidt.5 The population prevalence of myopia in the sample of Sperduto et al 35averaged 35%; however, it varied with both age and sex (range 18-68%). Furthermore, this population also contained high myopes and we were not able to exclude these from the analysis. Fortunately, the high myopes were vastly outnumbered by low myopes and thus were unlikely to affect the magnitude of the risk ratio for low myopia that was obtained. Because of the mode in which results were presented by Sperduto et al,35 risk to sibs was inferred from families containing only two sibs, in which both, one, or neither of the sibs were affected by myopia. There were 255 such families (510 sibs) and the prevalence of myopia in this group was 39% (198 of the 510 sibs). With 57 families having two myopic sibs, the risk ratio for sibs (λs) for low myopia was therefore ≈1.5.
Results. Goldschmidt5 screened the medical records of 95% of the children born in Copenhagen in the year 1948 and found that 9.5% of the children sampled were myopic. He then examined 93% of the myopic children in person to determine their precise ocular refraction (the children being aged 13-14 at the time of the survey). Thirty-nine children were classified by Goldschmidt as high myopes giving a prevalence of 0.45%. Family data were available for 36 of these 39 subjects. Of the three families for which data were not reported, one family did not want to cooperate with the investigation, while in the other two the probands lived in foster homes. Refractive data for one of the parents was not available for five of the 36 families, leaving 31 “complete” families available for reanalysis.
We calculated the midparent-offspring heritability estimates for ocular refraction in the 31 complete families to be 0.65 and 0.68 for right and left eyes, respectively (both significantly above zero at the p<0.01 level). In contrast, the sib-sib heritabilities for the 36 incomplete families described by Goldschmidt5 were not significantly different from zero (h2 = −0.09 and +0.12 for right and left eyes, respectively). No improvement was gained by restricting the sib-sib analysis to just those sibs from the 31 complete families. The midparent-offspring heritability estimates calculated here for the families of Goldschmidt's highly myopic probands are higher than those found previously (for unselected families, table 1), while the sib-sib heritability estimates for this sample are much lower than has been found previously (table 1).
The risk ratio for sibs (λs) for high myopia, calculated from Goldschmidt's data, is 20.0 (four sibs out of a total of 44 were highly myopic). Furthermore, if only sibs older than the probands are considered, the risk ratio is even higher (λs=27.5, since three out of 24 older sibs were affected), suggesting that the inclusion of sibs who have yet to develop high myopia leads to the risk ratio being underestimated.
The study by Sperduto et al 35is the only one containing sufficient detail to enable a risk ratio for low myopia to be calculated. This study yields a λs≈1.5 for low myopia. Importantly, because the population prevalence of myopia in the unselected sample studied by Sperdutoet al 35 averaged 35%, the risk ratio could never have exceeded the theoretical maximum of 2.9 (numerator in λs equation must be ⩽1, denominator = 0.35).
Discussion. Several factors limit the reliability of the heritabilities and risk ratios reported here. Consequently, these results should be interpreted with caution and considered only as estimates. Some of the more important limiting factors are discussed below.
Results from an older Danish population group described in Goldschmidt's 1968 paper5 suggest that many of the children he sampled had yet to develop myopia. In 18-20 year old Danish military conscripts, the prevalence of myopia was 14.5%, whereas it was only 8.5% in the 13-14 year old boys. Furthermore, while 0.6% of his conscript sample had myopia >−6.50 D, only 0.3% of the male children had this degree of myopia. Thus, it seems very likely that some children who would eventually become high myopes were not followed up in Goldschmidt's analysis of parents and sibs. This effect of sampling a population group at an age before myopia has stabilised is likely to have led to the sib-sib heritability being underestimated, since heritability calculations use a correlation approach that relies on an analysis of quantitative data. Also, since ocular refraction continues to vary with age,6 35 parent-offspring heritability estimates might also be affected. Risk ratio estimates, in contrast, are based on an all or nothing approach, the presence or absence of a trait. Thus, risk ratios may be less susceptible to problems caused by age related variations in refraction than heritabilities.
Despite the large population targeted by Goldschmidt,5only 36 highly myopic probands and their families were available for analysis. The use of such a small sample will inevitably have led to inaccuracy in both heritability and risk ratio estimations.
It could be argued that the λs values for high and low myopia reported here are not strictly comparable, since they relate to population groups that not only derive from different geographical areas, but that are one and a half generations apart. However, since the population prevalence of myopia in Goldschmidt's population sample was at least 15%, the λs for low myopia for this group could not have exceeded the theoretical maximum of 6.7 (1 divided by 0.15) and therefore would still be much less than that of high myopia.
The heritability estimates derived here from midparent-offspring and sib-sib analyses suggest that genetic factors might contribute to the determination of ocular refraction differently in highly myopic members of the population compared to the general population. However, it is unclear why the sib-sib heritability in the present sample should be so low, especially since sib-sib heritability has usually been thought to overestimate the role of additive gene effects in determining ocular refraction.13 31 Falconer31 suggested that midparent-offspring heritability is likely to be the most reliable heritability indicator in human populations. According to this postulate, our results can be interpreted as suggesting that genetic factors exert a greater effect in determining high myopia than low myopia.
Significantly, the high risk ratio for sibs (λs) for high myopia found here also suggests an important role for heredity in determining extremes in ocular refraction. Furthermore, our data are consistent with the idea that high myopia is more likely to be determined by familial factors than is low myopia.
Very recently, Young et al 29 30 described two discrete loci for simple high myopia in pedigrees showing an apparently autosomal dominant pattern of inheritance. Interestingly, in three of the four families in which Goldschmidt's highly myopic probands had an affected sib, one or more of the parents was also affected. Moreover, in the nine families that had at least one affected parent, 50% of sibs were affected. Both of these results are suggestive of a dominant pattern of inheritance, and so dominant genes may be responsible in large part for the high λs for high myopia. However, since this dominant transmission pattern was only evident in nine of the 36 families in Goldschmidt's cohort, it seems likely that other modes of inheritance of high myopia are more common than dominant inheritance. The failure to identify a major dominant myopia gene by segregation analysis36 is consistent with this view, although a recent study of the inheritance of corneal astigmatism37 suggests that this type of segregation analysis is not always capable of disclosing dominant gene effects.
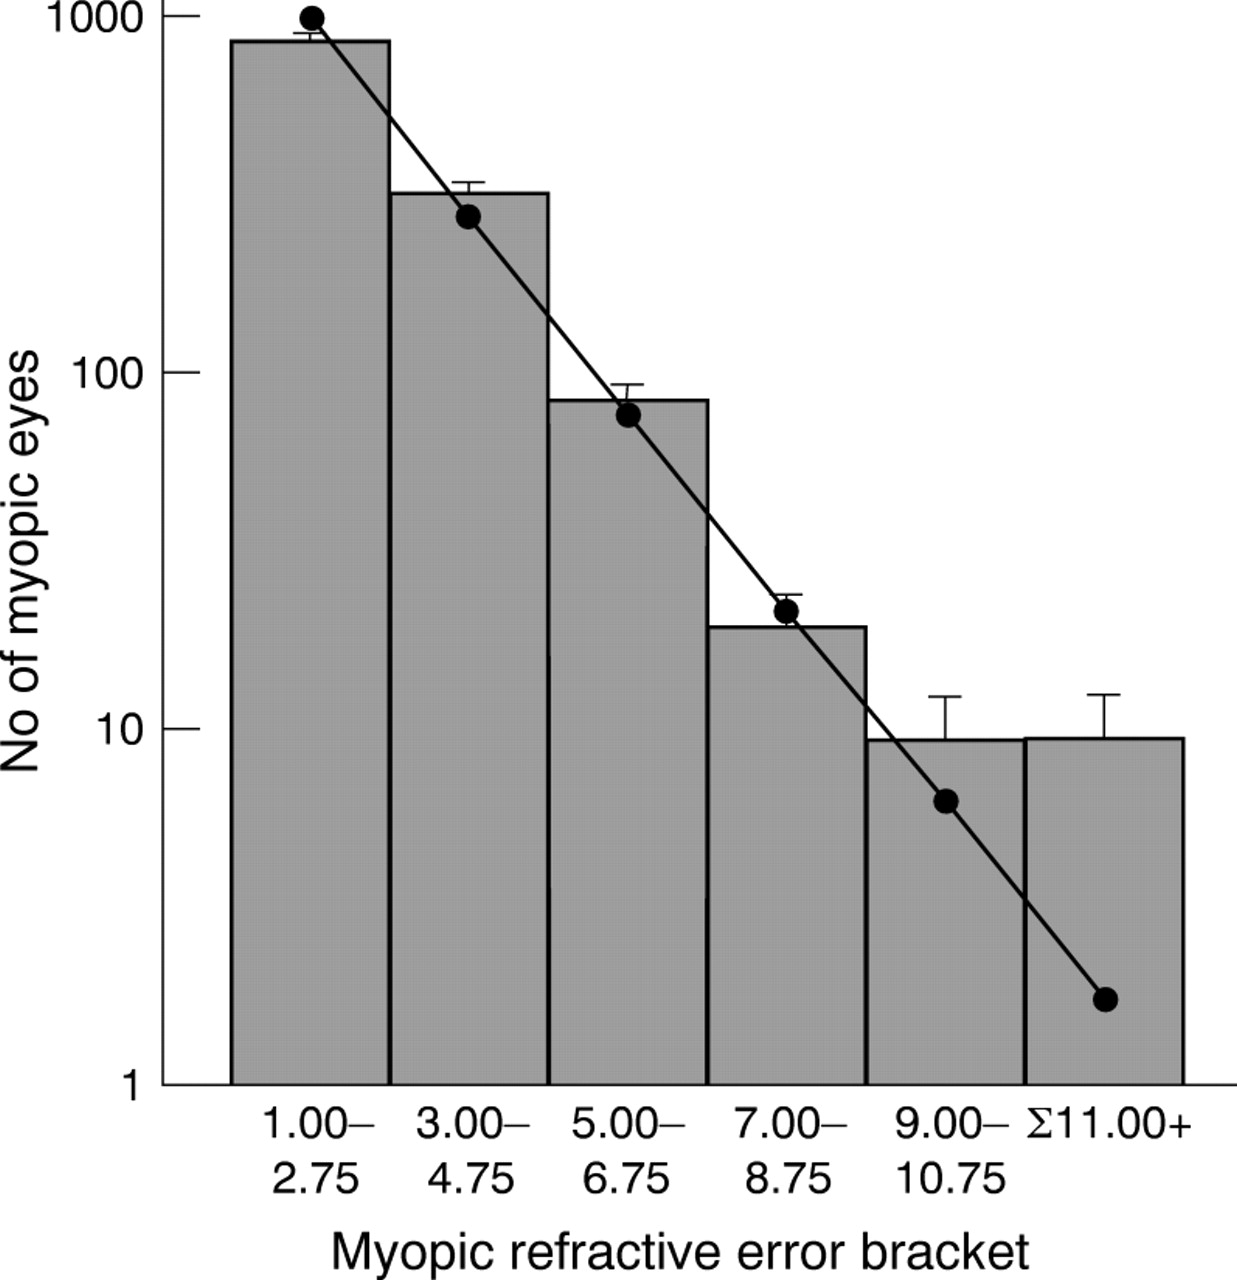
The frequency distribution of ocular refraction is leptokurtotic rather than normal, and skewed towards myopia.4 38-40 However, a reanalysis of Goldschmidt's sample of 815 children shows that for this population, the frequency distribution of the number of myopic eyes can be described as a single inverse exponential function, except for myopia >−9.00 D (fig 1). It is tempting to speculate that this bimodal (or multimodal) distribution reflects two or more aetiologically distinct types of myopia. Betsch,39Scheerer,40 Tron,42 and Hirsch43all reached similar conclusions, albeit with a variety of optimal “cut off” levels at which point the bi- or multimodality became evident. However, none of these authors based their analyses on an unselected population group such as that provided by Goldschmidt. The differences in heritability and risk ratio between high and low myopia are consistent with this idea of aetiological bimodality, although this is clearly an oversimplification.43 44
Frequency distribution of myopic ocular refractions in 13-14 year olds (data from Goldschmidt5). Goldschmidt's data was found to fit a single inverse exponential function (Number of eyes = 3528 e0.6394 × ocular refraction, r2 = 0.99) when myopia ⩾−9.00 D was not included in the analysis (shown as individual data points and line of regression). (Note that in estimating best spheres to correct refractive errors in subjects, the spheres available to the clinician are quantised in units of 0.25 diopters. Consequently, in the groupings shown in the figure there are inevitable systematic errors of classification in a (presumably) continuous refractive error distribution, at the margins of 2.75 to 3 D, for example. However, this small error is unlikely to have a significant effect on the observed distribution of refractive errors.) Error bars show √n, where n is the number of observations (that is, number of eyes). The data point plotted for Σ11.00+ was calculated using the above equation, for myopia extending from −11.00 D to −30.00 D. For myopia of −9.00 D and above, the inverse exponential function predicts fewer cases than were actually observed, suggesting a possibly bimodal distribution.
The risk ratio for sibs for high myopia was approximately 20, compared to ≈1.5 for low myopia. In addition, the midparent-offspring and sib-sib heritabilities for the families of Goldschmidt's high myope population differed from those reported for unselected families. Finally, it was noted that the frequency distribution of myopia in Goldschmidt's unselected child population group conformed well to a biphasic distribution, consistent with the occurrence of two aetiologically distinct, major forms of myopia. Taken together, these results suggest that genetic factors play a significant role in the development of high myopia.
Acknowledgments
This work was supported in part by grants from the National Eye Research Centre (grants SCIAD004 and SCIAD015).