Article Text

Abstract
Background/Aims To develop a convolutional neural network (CNN) to detect symptomatic Alzheimer’s disease (AD) using a combination of multimodal retinal images and patient data.
Methods Colour maps of ganglion cell-inner plexiform layer (GC-IPL) thickness, superficial capillary plexus (SCP) optical coherence tomography angiography (OCTA) images, and ultra-widefield (UWF) colour and fundus autofluorescence (FAF) scanning laser ophthalmoscopy images were captured in individuals with AD or healthy cognition. A CNN to predict AD diagnosis was developed using multimodal retinal images, OCT and OCTA quantitative data, and patient data.
Results 284 eyes of 159 subjects (222 eyes from 123 cognitively healthy subjects and 62 eyes from 36 subjects with AD) were used to develop the model. Area under the receiving operating characteristic curve (AUC) values for predicted probability of AD for the independent test set varied by input used: UWF colour AUC 0.450 (95% CI 0.282, 0.592), OCTA SCP 0.582 (95% CI 0.440, 0.724), UWF FAF 0.618 (95% CI 0.462, 0.773), GC-IPL maps 0.809 (95% CI 0.700, 0.919). A model incorporating all images, quantitative data and patient data (AUC 0.836 (CI 0.729, 0.943)) performed similarly to models only incorporating all images (AUC 0.829 (95% CI 0.719, 0.939)). GC-IPL maps, quantitative data and patient data AUC 0.841 (95% CI 0.739, 0.943).
Conclusion Our CNN used multimodal retinal images to successfully predict diagnosis of symptomatic AD in an independent test set. GC-IPL maps were the most useful single inputs for prediction. Models including only images performed similarly to models also including quantitative data and patient data.
- retina
- diagnostic tests/investigation
- imaging
Data availability statement
Data from this study is available upon reasonable request from our corresponding author, Dr. Sharon Fekrat, sharon.fekrat@duke.edu.
Statistics from Altmetric.com
Introduction
Alzheimer’s disease (AD) is a common neurodegenerative disease affecting 1.6% of the population in the USA. Expert estimates suggest 3.3% of Americans will be impacted by 2060.1 While brain imaging including MRI and positron emission tomography (PET), cerebrospinal fluid (CSF) biomarkers such as amyloid beta (Aβ) and tau, and serologic testing including genetic markers may each have diagnostic value, their limitations, including high cost, invasiveness, and limited sensitivity and specificity, have forestalled their routine use in clinical practice.1 2 Thus, AD remains primarily a clinical diagnosis.3
Abnormalities in the retina have been associated with the presence of neurodegenerative disease, and AD in particular.4 Amyloid beta plaques and tau neurofibrillary tangles, the hallmark neuropathological features of AD, have been observed in retinal tissues of persons with AD.5 6 A recent study, however, found that retinal Aβ levels in AD and in cognitively healthy older adults were similar, while retinal tau levels were elevated in AD.6 Thus, the retina may demonstrate characteristic structural changes in individuals with AD.
In fact, retinal imaging has identified structural changes in the neurosensory retina and the retinal microvasculature in persons with AD.6 Optical coherence tomography (OCT) imaging has highlighted changes in macular volume,7 8 ganglion cell-inner plexiform layer (GC-IPL) thickness,8–11 retinal nerve fibre layer (RNFL) thickness7–9 12 and subfoveal choroidal thickness.8 13 14 OCT changes in the ellipsoid zone and retinal pigment epithelium,15 macular volume,7 RNFL thickness16 and GC-IPL thickness16 have also demonstrated correlation with cognitive test scores in AD. Additionally, peripheral retinal changes including increased drusen and decreased retinal vascular complexity have been demonstrated using ultra-widefield (UWF) scanning laser ophthalmoscopy (SLO).17 18 OCT angiography (OCTA) has been used to detect retinal microvascular changes in AD, specifically decreased vessel density (VD) and perfusion density (PD) in the superficial capillary plexus (SCP)13 14 16 and increased foveal avascular zone (FAZ) area.13 14 Recent studies have also demonstrated clinical correlation between these OCTA parameters and Mini Mental State Examination (MMSE) scores.14 16 17
More recently, advances in machine learning have spawned significant efforts to facilitate the clinical diagnosis of AD. Published works have largely focused on machine learning analysis of neuroimaging including MRI18 19 or a combination of MRI and PET images.20 21 Other machine learning models have incorporated neuroimaging data along with laboratory data (eg, CSF biomarkers)22 or clinical data (eg, MMSE) to augment predictive capabilities.23 Machine learning models using MRI and PET image inputs have reported 93.3%20 and 97.1%21 diagnostic accuracy when comparing patients with AD to cognitively normal controls. Another model using only MRI inputs reported 99% diagnostic accuracy for differentiating patients with AD from cognitively normal controls.19
While these studies demonstrate promising results, their clinical application is limited by the expense and time required to obtain neuroimaging data. Links between AD and retinal changes, coupled with the non-invasive, cost-effective and widely available nature of retinal imaging platforms, position multimodal retinal image analysis as an attractive alternative for AD diagnosis.24
In the present study, we acquired multimodal retinal images, including OCT, OCTA and UWF SLO colour and autofluorescence (FAF), in patients with an expert-confirmed clinical diagnosis of AD and in cognitively healthy controls in order to train, validate and test a convolutional neural network (CNN) that predicts the probability of AD, P(AD), for each eye. At the time of this publication, there were no published machine learning models using multimodal retinal image inputs for prediction of AD diagnosis. This exploratory study was designed as a proof of concept that symptomatic AD could be detected by a CNN when applied to an independent test dataset.
Methods
Participants
Study participants were enrolled in a cross-sectional study (Clinicaltrials.gov, NCT03233646) approved by Duke Health System’s Institutional Review Board. This study followed the tenets of the Declaration of Helsinki. Written informed consent was obtained for each subject.
Detailed methods describing patient eligibility and selection criteria have been previously published.16 In brief, exclusion criteria included a known history of non-AD dementia, diabetes mellitus, uncontrolled hypertension, demyelinating disorders, high myopia or hyperopia, glaucoma, age-related macular degeneration, other vitreoretinal pathology, any history of ocular surgery apart from cataract surgery and corrected ETDRS visual acuity <20/40 at the time of image acquisition.
Subjects with AD aged ≥50 years were enrolled from the Duke Memory Disorders Clinic. Subjects with AD were evaluated and clinically diagnosed by experienced neurologists, and all medical records were reviewed by one of two expert neurologists (AL and JRB) to confirm a clinical diagnosis of AD using the guidelines of the National Institute on Ageing and Alzheimer’s Association.3
Cognitively healthy control subjects were either community volunteers aged ≥50 years without memory complaints or were participants from Duke’s Alzheimer’s Disease Research Center (ADRC) registry of cognitively normal community subjects. All subjects underwent corrected ETDRS visual acuity measurement and MMSE to evaluate cognitive function on the day of image acquisition.
Test set patients were imaged 1 year after the training and validation set patients. Test set patients were also imaged by different photographers than the training and validation set patients.
Image acquisition
Non-dilated subjects were imaged with the Zeiss Cirrus HD-5000 Spectral-Domain OCT with AngioPlex OCT Angiography (Carl Zeiss Meditec, Dublin, California, USA, V.11.0.0.29946).16 Colour map reports of GC-IPL thickness were generated using the Zeiss OCT software following automated segmentation. GC-IPL thickness maps with motion artefact or poor centration were excluded. SCP OCTA en face 3×3 mm and 6×6 mm images centred on the fovea were acquired. OCTA images with low signal strength (less than 7/10), poor centration, segmentation artefacts or motion artefacts were excluded. UWF fundus colour and FAF images were captured using a non-mydriatic UWF SLO (Optos California, Marlborough, Massachusetts, USA). Images with motion artefact or eyelid artefacts within the major vascular arcades were excluded.
Model development
A schematic of the structure of the CNN is shown in figure 1. The model was trained in end-to-end fashion to receive inputs of multimodal retinal images, OCT and OCTA quantitative data, and patient data to produce a score suggesting the probability that a patient carried a clinical diagnosis of symptomatic AD. As individual imaging modalities were expected to have different salient features, the model used a shared-weight image feature extractor to extract useful modality-agnostic features that were then fed to a modality-specific function (fully connected (FC) layer)25 to obtain modality-aware preclassification AD scores. UWF colour and FAF images were stacked in a common modality-specific function given that they share similar visual structures (figure 1). The image feature extractor (described in online supplemental figure 1) has a structure consistent with the first five layers of the ResNet1825 neural network. Figures 2 and 3 show examples of the multimodal retinal images (figures 2a, 2 c-f; figures 3a, 3 c-f) and attention maps (figures 2b, 3b) that were generated to visualise the discriminative image regions in OCTA images. A description of the attention mapping process is provided in the online supplemental appendix.
Supplemental material
Supplemental material

Illustration of the architecture of the end-to-end Alzheimer’s disease (AD) prediction model. For each imaging modality, the model used a shared-weight image feature extractor (depicted in the dotted box) to create feature maps for each imaging modality (denoted as fOCTA, fColor and FAF and fGC-IPL ) and passed this result to modality-specific fully connected layers (denoted as FCOCTA, FCColor and FAF and FCGC-IPL) to obtain preclassification scores for AD. The details of the image feature extractor can be found in online supplemental figure 1. For the clinical data, the model used a fully connected layer (denoted by FCother) to obtain a preclassification score. The model combines the preclassification scores from multimodal retinal images, OCT and OCT angiography quantitative data, and clinical data, and then scales it to the [0,1] probability range using a sigmoid function26 to obtain the final prediction result, referred to as probability of AD, P(AD). GC-IPL, ganglion cell-inner plexiform layer; FAF, fundus autofluorescence; OCT, optical coherence tomography; OCTA, optical coherence tomography angiography; UWF, ultra-widefield.

Image montage from the right eye of an 85-year-old patient with Alzheimer’s disease (AD). The probability of AD value, P(AD), for this eye was 0.344 (strongly predicting the subject carried a diagnosis of symptomatic AD based on figure 4A) when using the best model (GC-IPL, quantitative data and patient data). (A) 6×6 mm optical coherence tomography angiography (OCTA) superficial capillary plexus (SCP) image. Note the loss of density of the SCP surrounding the fovea. (B) Attention map for the 6×6 mm OCTA SCP image. The model demonstrates attention on the foveal avascular zone and on several areas in the temporal macula. Some foci in the inferior macula appear to correlate with areas of decreased vessel density. (C) Ganglion cell-inner plexiform layer (GC-IPL) thickness map showing diffuse GC-IPL thinning with an average thickness of 61 µm. (D) Ultra-widefield (UWF) scanning laser ophthalmoscopy (SLO) colour image. (E) UWF SLO autofluorescence image. (F) Retinal nerve fibre layer quadrant thickness map demonstrating the thickness of each region in microns with superior thinning.

Image montage from the left eye of a 72-year-old cognitively healthy control subject. The probability that the patient carried a diagnosis of symptomatic Alzheimer’s disease (AD), P(AD), for this eye was 0.115 (strongly predicting that this was a control subject based on figure 4A) when using the best model (ganglion cell-inner plexiform layer (GC-IPL) and quantitative data and clinical data). (A) 6×6 mm optical coherence tomography angiography (OCTA) superficial capillary plexus (SCP) image. (B) Attention map for the 6×6 mm OCTA SCP image. The model demonstrates attention on the foveal avascular zone as well as scattered foci elsewhere in the macula. Some foci of attention, particularly the superior patches, appear to correlate with areas of decreased vessel density on the OCTA SCP image. (C) GC-IPL thickness map showing normal thickness. Average thickness was 80 µm. (D) Ultra-widefield (UWF) scanning laser ophthalmoscopy (SLO) colour image. (E) UWF SLO autofluorescence image. (F) Retinal nerve fibre layer quadrant thickness map demonstrating the thickness of each region in microns without areas of thinning.
For patient data, the model used an FC layer (FCother in figure 1) to obtain the preclassification score for AD. The combined result was obtained by averaging the preclassification AD scores from the retinal images (UWF colour, UWF FAF, GC-IPL maps and OCTA) with OCT and OCTA quantitative data and patient data and scaled to the [0, 1] probability range using a sigmoid function26 (figure 1). The model is trained to maximise binary cross-entropy loss (ie, the likelihood that multimodal inputs are correctly assigned to either the AD or control group).
The model was trained in PyTorch with the Adam optimizer27 for 100 epochs with an initial learning rate of 0.01 for FC layers, and 0.0001 for other layers where parameters are initialised by the pretrained ResNet18. A decay of 0.5 is applied to the learning rates every 10 epochs. We tested different weights from 0.001 to 10 for regularisation loss and found that 0.01 worked best. The training loss dropped slowly after epoch 40, and the validation loss stayed consistent during epochs 50–100. Due to our sample size, we stopped the training at epoch 100 to avoid overfitting. The final prediction results reported are averages over epochs 50–100, which represent conservative performance estimates to avoid bias in selection of the best performing epoch.
Table 1 describes the performance results for 11 individual models that were trained using various input combinations. The architecture of each model is the same as the model outlined in figure 1, with the omission of the portions corresponding to unused input modalities. For example, if the inputs included only GC-IPL and OCTA, then we kept the feature extractor and FC layers for those two modalities (ie, the FC layers for GC-IPL and OCTA), and dropped the other modules (ie, the FC layers for UWF and quantitative and patient data), and then trained the model.
Predictive capabilities of each model in the convolutional neural network
The data used to develop the model represented the intersection of each of the imaging datasets (ie, only included patients with full sets of images). Two hundred and eighty-four eyes from 159 patients, including 222 eyes from 123 cognitively healthy control subjects and 62 eyes from 36 AD subjects, were used to develop and evaluate the model (online supplemental table 1a-c). We initially imaged 186 eyes, which were used for training and validating the model. Subsequently, 68 independent eyes of 34 subjects were imaged and used for the test set. Online supplemental table 2a-c describes the subjects included in the training, validation and test sets. For each eye, UWF colour images, UWF FAF images, 6×6 mm OCTA macular images and macular GC-IPL thickness colour map images were included. There was no overlap between subjects in the training, validation and test sets. Neither the model design nor its development was informed by the test set. The model did not learn from the test set and made no changes based on test set information. Performance of each model is reported in terms of area under the receiver operating characteristic curve (AUC), which represents the ability of the model to correctly predict a symptomatic AD diagnosis for each individual eye analysed. Sensitivity and specificity values are also reported for the best-performing model based on a threshold value determined using the Youden’s index for our receiver operating characteristic (ROC) curve.
Supplemental material
Supplemental material
Image cropping
Analysis was conducted using the unedited image files for the UWF colour and UWF FAF images with automated cropping which preserved the central 1800×1800 pixels (originally 4000×4000 pixels). Cropping was performed to minimise eyelid artefacts. SCP OCTA and GC-IPL colour map images did not undergo any cropping or preprocessing.
Descriptive patient data and quantitative imaging data
Patient data included age, sex, ETDRS visual acuity converted to the logarithm of the minimal angle of resolution (logMAR) and years of education. The model also used quantitative OCT and OCTA imaging data derived from the Zeiss software (Carl Zeiss Meditec, Version 11.0.0.29946). References to ‘OCT/OCTA quantitative data’ or ‘quantitative data’ throughout the manuscript encompass OCT parameters including subfoveal choroidal thickness (manually measured on foveal enhanced depth imaging scan by two masked graders—BP and CBR—and adjudicated by another masked grader—DSG), central subfield thickness, average GC-IPL thickness and average RNFL thickness; 3×3 mm OCTA parameters including area of the FAZ, FAZ circularity index (scale 0–1), SCP PD for the 3 mm ETDRS circle and 3 mm ring,16 and SCP VD in the 3 mm circle and 3 mm ring; and 6×6 mm OCTA parameters including PD and VD in the 6 mm circle, 6 mm outer ring and 6 mm inner ring.
Statistical analysis
Statistical analysis was performed to compare the OCT and OCTA quantitative data and patient data using XLSTAT (Addinsoft, Paris, France). χ2 tests were used to compare categorical variables, and Wilcoxon rank-sum tests were used to compare continuous variables.
Results
Online supplemental table 1a-c summarises patient and quantitative data used by the model for AD and control subjects. Comparisons of OCT and OCTA parameters in AD and control subjects have been described in our previous work.16 Briefly, subjects with AD in the present study had significant differences in OCT parameters including GC-IPL thickness and subfoveal choroidal thickness (online supplemental table 1b). Significant differences in OCTA parameters included PD for the 3 mm ring, VD for the 3 mm circle and 3 mm ring, and PD for the 6 mm outer ring (online supplemental table 1c). Mean MMSE scores do not appear in online supplemental table 1, as they were not used as inputs in the CNN. MMSE scores were 29.2 (SD=1.2) for control subjects and 21.9 (SD=4.5) for subjects with AD (p<0.0001). Online supplemental table 2a-c includes a summary of the patient, OCT and OCTA quantitative data included in the model. Values for each input variable were similar for the training, validation and test sets. The model was trained, validated and tested with 11 different sets of inputs as described in table 1.
The best-performing model, including GC-IPL maps, quantitative data and patient data, achieved an AUC of 0.861 (95% CI 0.727, 0.995) on the validation set and 0.841 (95% CI 0.739, 0.943) on the test set.
P(AD) is also represented as box and whisker plots for AD and control subjects in figures 4A and 5A. Figure 4 describes the performance of the GC-IPL, quantitative data and patient data model. The ROC curve for this model’s performance on the validation set (figure 4B) was used to calculate the Youden’s index, 0.750, which was used to select sensitivity (100%) and specificity (75%) values. Figure 4A displays a Youden threshold value of 0.208, the P(AD) value from this input combination representing our decision point for determining sensitivity and specificity values reported above. Figure 4C represents the changes in performance of the GC-IPL map, quantitative data and patient data input model with each epoch. The model was trained for 100 epochs without using the test set, and from which we observed (figure 4C) that performance on the validation set was stable (flat) after epoch 50. After setting an epoch interval to 50–100, for which performance was known to be stable, we ran predictions on the test set for the entire epoch set (1–100). Given that the test set performance was also stable from epochs 50–100, we presented test set results by averaging predictions from epochs 50–100 (table 1).
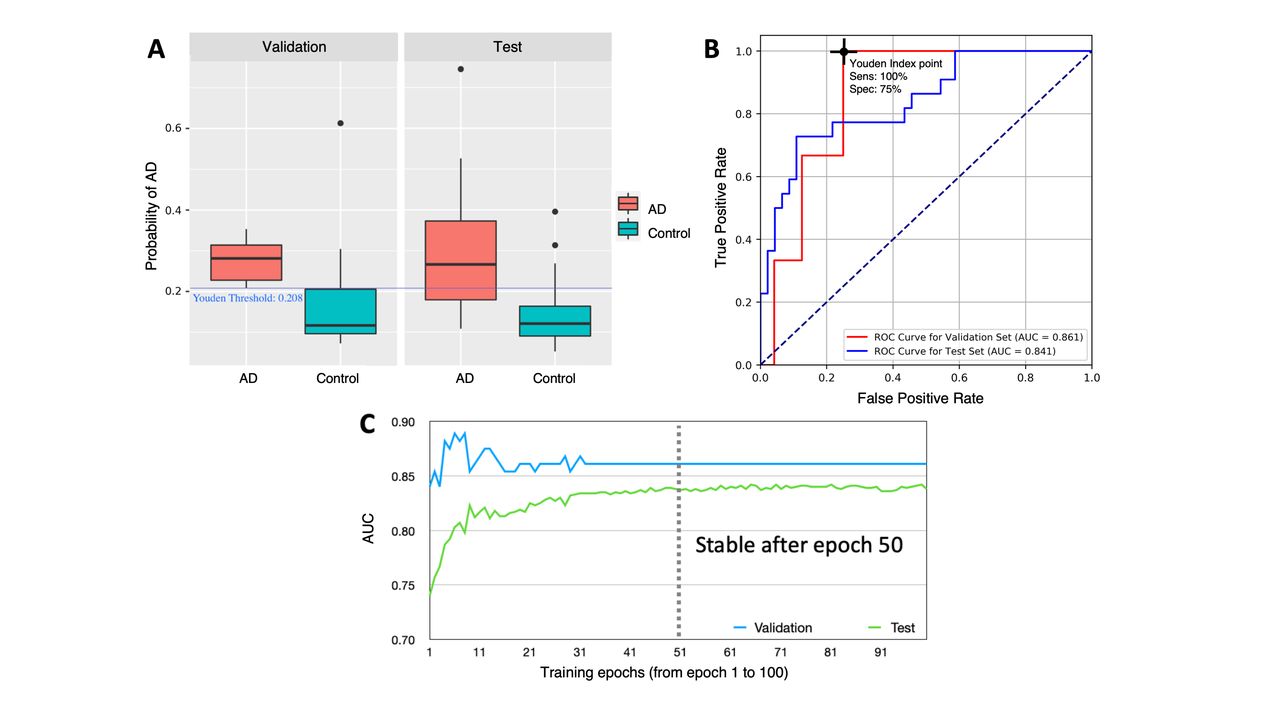
(A) Box and whisker plots of probability of Alzheimer’s disease (AD), P(AD), predictions for the best-performing model: ganglion cell-inner plexiform layer (GC-IPL) thickness maps, quantitative data and patient data, for the cognitively healthy control and AD groups on the validation and test data sets. Validation set: AD median 0.281, IQR (0.208, 0.353), control median 117, IQR (0.073, 0.305). Test set: AD median 0.266, IQR (0.108, 0.526), control median 0.1207, IQR (0.052, 0.269). (B) Receiver operating characteristic (ROC) curve for P(AD) for each eye in the validation set (red line) and test set (blue line) using the GC-IPL thickness maps, quantitative data and patient data model. Area under the curve (AUC) values for the validation and test sets along with sensitivity and specificity values for the test set are reported. (C) Changes in AUC of the GC-IPL map, quantitative data and patient data model with each epoch during training, from which minimal variability is seen after epoch 40.
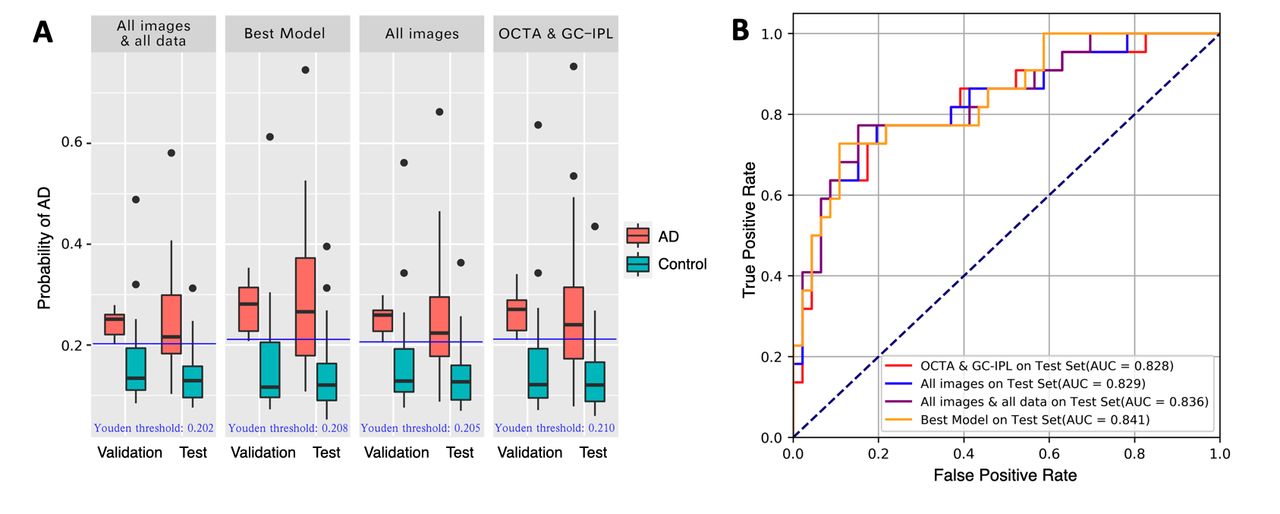
(A) Box and whisker plots of probability of Alzheimer’s disease (AD) P(AD), for the following models: all images and all data; GC-IPL, quantitative data and clinical data (labelled as Best Model); all images; and OCTA and GC-IPL on the validation and test sets. Each of these box and whisker plots is labelled with a Youden threshold value for that model calculated using the corresponding receiver operating characteristic (ROC) curve in figure 5B. (B) Comparison of ROC curves for selected model.
Figure 5 compares the performance on several different models, including all images and all data; GC-IPL maps, quantitative data and patient data (labelled as Best Model); all images only; and OCTA images and GC-IPL maps. Each of these box and whisker plots is labelled with a Youden threshold value for that input combination calculated using the corresponding ROC curve in figure 5B.
Discussion
To our knowledge, this is the first attempt to develop a CNN to detect AD diagnosis using multimodal retinal imaging. This study represents proof of concept that machine learning analysis of multimodal retinal images has potential for future clinical application. Our best-performing model, using retinal images, OCT and OCTA quantitative data, and patient data, achieved an AUC of 0.841 on an independent test set. Additional training using images from a larger, more diverse population with known confounders may further strengthen performance.
The decision to incorporate OCT and OCTA inputs in our CNN was based on our prior statistical comparison of parameters from these modalities in AD and control subjects.16 Images used in the training and validation sets in the present study overlapped, in part, with those images assessed in cohorts reported in our prior work.16 However, the images in the independent test set included herein had not yet been obtained at the time of our prior publication.
When considering performance on the independent validation and testing sets demonstrated in table 1, evaluation of OCTA images and GC-IPL map images with our CNN demonstrated better AUC values than UWF colour or UWF FAF image inputs alone. GC-IPL maps demonstrated the best performance as a single input, with AUC 0.809 (0.700, 0.919). Particularly when considering 95% CIs demonstrated in table 1 for UWF images, neither colour nor FAF images used as single inputs demonstrated a consistent ability to differentiate AD and control subjects. Various models outlined in table 1 also suggest low utility of UWF fundus images for predicting AD diagnosis, as the two best-performing models excluded UWF images. Furthermore, the OCTA and GC-IPL map model without UWF images outperformed the combination of all images. Apart from the UWF images, comparison of the input combinations in table 1 suggests that adding more data modalities provided incremental improvement in predictive value.
A concern inherent in smaller datasets is that when models use a smaller number of images for training, they may not learn to consistently recognise all of the salient features in the imaging modality input. To address this concern, we added quantitative information in the OCTA quantitative data that is based on the OCTA SCP images already used as model inputs. This same type of redundancy was included in the quantitative data for GC-IPL thickness via addition of GC-IPL thickness colour maps. We suspected this redundancy might improve the model’s performance by maximising the useful information extracted from each imaging modality. Interestingly, we found that our all images model and our OCTA and GC-IPL model performed similarly to our all images and all data model and our GC-IPL, OCTA, quantitative data and patient data models, which contain this intentional redundancy (table 1). The strong performance of our models that used only images without addition of supportive quantitative data suggests that an effective diagnostic model using only multimodal images without quantitative summary data or patient data could predict a subject carries a diagnosis of symptomatic AD.
Model structure
To use multimodal retinal images, our model employed an image feature extractor to detect useful features from each imaging modality. The final probability of whether an eye carries a diagnosis of symptomatic AD is a combination of signals from each of the multimodal retinal images, OCT and OCTA quantitative data, and patient data, scaled by the sigmoid activation function.26 The image feature extractor is based on a CNN model. While the promising performance of CNNs is accompanied by a huge amount of annotated data, our study population had 283 eyes and each UWF image contained 3 240 000 pixels (1800×1800).
A concern with training a CNN-based model with a dataset of this size is overfitting, meaning the model performs very well on the training data (overfitting the observed data), but performs poorly on testing (unobserved or new data). To reduce overfitting, we carefully designed the model architecture, using L2 and L1 regularisation, data augmentation and transfer learning.28 29 We have included figure 4C to allay overfitting concerns as figure 4C demonstrates: (1) the model has learnt as performance on the validation set improves over the initial epochs; (2) the performance on the test set stabilises after epoch 50; (3) validation and test performance metrics do not decrease after the model reaches peak performance. If overfitting were occurring, we would expect validation and test set performance metrics to decrease after reaching peak performance rather than stabilising.
Another concern inherent in smaller datasets is that when models have a smaller number of images to use for training purposes, they may not learn to consistently recognise all of the salient features present in the imaging modality inputs. To address this concern, we added quantitative information from OCTA SCP images and GC-IPL thickness colour maps. We suspected this redundancy would improve the model’s performance by maximising the useful information extracted from each imaging modality. Details of the model structure and the techniques used to maximise the smaller dataset can be reviewed in the online supplemental appendix.
Limitations
In reviewing our imaging data, many UWF images included eyelid artefacts. Initially, we attempted to address this by generating image masks to hide artefacts (online supplemental appendix). The use of masked images provided no advantage over cropped images in the predictive value of the model, so we elected for standardised automated cropping of UWF images rather than masking. Despite these attempts to improve UWF data quality, UWF colour and FAF images consistently contributed little predictive value. Prior research using UWF colour fundus imaging in patients with AD has demonstrated peripheral retinal alterations including increased peripheral drusen deposition30 31 and decreased branching complexity throughout the retinal vasculature.30 Thus, using cropped images may have deprived the model of potentially pertinent information in the peripheral retina.
To determine what information the model identified and used in the images to make decisions, attention maps were created. Given the relatively lower AUC values associated with use of the UWF images, UWF attention maps demonstrated inconsistent, multifocal areas of attention (examples in online supplemental figure 2). However, review of the OCTA image attention maps demonstrated consistent foci of attention on the FAZ (figures 2B and 3B). Prior OCTA studies have demonstrated retinal microvascular changes in AD, including increased FAZ area,13 14 which may explain our model’s consistent attention to this area. Other scattered foci of attention were found throughout the OCTA attention maps, which appear to correlate with areas of decreased capillary density13 14 16 visible on the SCP OCTA images, perhaps best illustrated by the two patches of attention superiorly in figure 3B.
Supplemental material
In our patient cohort, neither brain MRI and PET images nor APOE ε4 status and CSF biomarkers were routinely used for diagnosis of symptomatic AD. This approach may leave some uncertainty in the differentiation of AD from other less common types of dementia; however, all participants with AD were evaluated by an experienced memory disorders clinician prior to enrolment, and a clinical diagnosis of AD was confirmed using National Institute on Ageing/Alzheimer’s Association clinical guidelines.3 Medical records of individuals with AD were reviewed by one of two experienced neurologists (AL or JB) to determine a final diagnosis. Another potential limitation to the generalisability of our model was that our dataset only included patients without known ocular disease in order to exclude potential confounders. Given the higher incidence of some ocular diseases in AD populations,32 it will be important in future studies to demonstrate diagnostic accuracy of the model in patients with common ocular diseases, such as glaucoma and diabetic retinopathy. Additionally, in the present dataset, we prescreened all images for quality and excluded poor quality images. To create an algorithm that can be used clinically for prediction of AD, our next-generation model will need to identify and exclude poor quality images. Finally, our model performance results demonstrated in table 1 exhibit relatively large variance. We suspect this can be attributed our sample size limitations.
Our CNN used multimodal retinal images with and without OCT and OCTA quantitative data and selected clinical data for automated detection of symptomatic AD and achieved a best AUC of 0.841 using an independent test dataset. GC-IPL maps were the most useful single inputs for prediction. Based on our promising findings, we plan to collect more multimodal retinal images from a larger and more diverse cohort, which may improve the diagnostic performance of our model and potentially allow future translation of this model into clinical settings. Strong performance of models containing only GC-IPL map images and OCTA images without quantitative data suggests that a CNN using only OCT and OCTA imaging inputs may have utility for prediction of a diagnosis of symptomatic AD without quantitative or clinical data supplementation. However, it remains uncertain how such retinal imaging models will compare to the diagnostic accuracy of established methods for AD diagnosis like neuroimaging and CSF or serologic biomarkers.
Data availability statement
Data from this study is available upon reasonable request from our corresponding author, Dr. Sharon Fekrat, sharon.fekrat@duke.edu.
Ethics statements
Patient consent for publication
References
Supplementary materials
Supplementary Data
This web only file has been produced by the BMJ Publishing Group from an electronic file supplied by the author(s) and has not been edited for content.
Footnotes
Presented at A portion of this data was presented at the 2019 Association for Research in Vision and Ophthalmology (ARVO) annual meeting in Vancouver, Canada.
Contributors CEW was the first author and drafted the manuscript. DW, RH and LC coauthored the manuscript, provided critical review, and designed the CNN. ACT, SS, CBR, SY, JB, BWP and AL were involved in patient recruitment, data management, imaging and review of the manuscript. ACT performed statistical analysis. DSG and SF designed the study, coauthored the manuscript and critically reviewed the manuscript.
Funding This research was supported in part by Alzheimer's Drug Discovery Foundation.
Competing interests None declared.
Provenance and peer review Not commissioned; externally peer reviewed.
Supplemental material This content has been supplied by the author(s). It has not been vetted by BMJ Publishing Group Limited (BMJ) and may not have been peer-reviewed. Any opinions or recommendations discussed are solely those of the author(s) and are not endorsed by BMJ. BMJ disclaims all liability and responsibility arising from any reliance placed on the content. Where the content includes any translated material, BMJ does not warrant the accuracy and reliability of the translations (including but not limited to local regulations, clinical guidelines, terminology, drug names and drug dosages), and is not responsible for any error and/or omissions arising from translation and adaptation or otherwise.
Linked Articles
- At a glance