Article Text

Abstract
Aim To develop a deep learning (DL) model that predicts age from fundus images (retinal age) and to investigate the association between retinal age gap (retinal age predicted by DL model minus chronological age) and mortality risk.
Methods A total of 80 169 fundus images taken from 46 969 participants in the UK Biobank with reasonable quality were included in this study. Of these, 19 200 fundus images from 11 052 participants without prior medical history at the baseline examination were used to train and validate the DL model for age prediction using fivefold cross-validation. A total of 35 913 of the remaining 35 917 participants had available mortality data and were used to investigate the association between retinal age gap and mortality.
Results The DL model achieved a strong correlation of 0.81 (p<0·001) between retinal age and chronological age, and an overall mean absolute error of 3.55 years. Cox regression models showed that each 1 year increase in the retinal age gap was associated with a 2% increase in risk of all-cause mortality (hazard ratio (HR)=1.02, 95% CI 1.00 to 1.03, p=0.020) and a 3% increase in risk of cause-specific mortality attributable to non-cardiovascular and non-cancer disease (HR=1.03, 95% CI 1.00 to 1.05, p=0.041) after multivariable adjustments. No significant association was identified between retinal age gap and cardiovascular- or cancer-related mortality.
Conclusions Our findings indicate that retinal age gap might be a potential biomarker of ageing that is closely related to risk of mortality, implying the potential of retinal image as a screening tool for risk stratification and delivery of tailored interventions.
- telemedicine
Data availability statement
Data are available in a public, open access repository.
Statistics from Altmetric.com
Introduction
Globally, the population aged 60 and over is estimated to reach 2.1 billion in 2050.1 Ageing populations place tremendous pressure on healthcare systems.2 Chronological age is a major risk factor for frailty, age-related morbidity and mortality. However, there is great variability in health outcomes among individuals with the same chronological age,3 implying that the rate of ageing at an individual level is heterogeneous. Biological age rather than chronological age can better represent health status and the ageing process. An accurate quantification of the biological age is significant for risk stratification and the delivery of tailored interventions.4
To date, several tissue-, cell-, molecular-, and imaging-based biological ageing markers have been developed, such as DNA-methylation status, brain age and three-dimensional (3D) facial age.5–8 However, the invasive feature of cellular and molecular ageing biomarkers, high cost and time-consuming nature of neuroimaging and facial ages, and ethical and privacy concerns of facial imaging, have limited their usefulness.
The retina is considered as a window to the whole body,9–13 which shares similar embryological origins, physiological features and anatomical structures with vital organs such as the heart, the brain and the kidney.9 10 14 A growing number of studies have suggested that the retinal microvasculature could reliably reflect the systemic circulation in vivo and the retinal neural tissue shared common pathological alterations of neurodegenerative diseases with the brain.14 15 In addition, the retina is amenable to rapid, non-invasive and cost-effective assessments. The advent of deep learning (DL) has greatly improved the accuracy of image classification and processing. Recent studies have demonstrated successful applications of DL models in the prediction of age using clinical images.6 7 16 For example, previous studies have used MRI data of the brain and the 3D facial images for age prediction (brain age and facial age).6–8 The clinical values of biological age gap (such as brain age gap, defined as brain age minus chronological age) in the prediction of neurodegenerative disease and mortality have been verified.6 8 Taken together, this raises the potential that biological age can be predicted by applying DL to retinal images. For optimal usefulness, viable biomarkers of ageing must also relate to the risk of age-related morbidity and mortality.
We therefore developed a DL model that can predict age from fundus images, known as retinal age. Using a large population-based sample of middle-aged and elderly adults, we investigated the association between retinal age gap, defined as the difference between retinal age and chronological age, and mortality.
Methods
Study population
The UK Biobank is a large-scale, population-based cohort of more than 500 000 UK residents aged 40–69 years. Participants were recruited between 2006 and 2010, with all participants completing comprehensive healthcare questionnaires, detailed physical measurements, and biological sample collections. Health-related events were ascertained via data linkage to hospital admission records and mortality registry. Ophthalmic examinations were introduced in 2009. The overall study protocol and protocols for each test have been described in extensive details elsewhere.17
Fundus photography
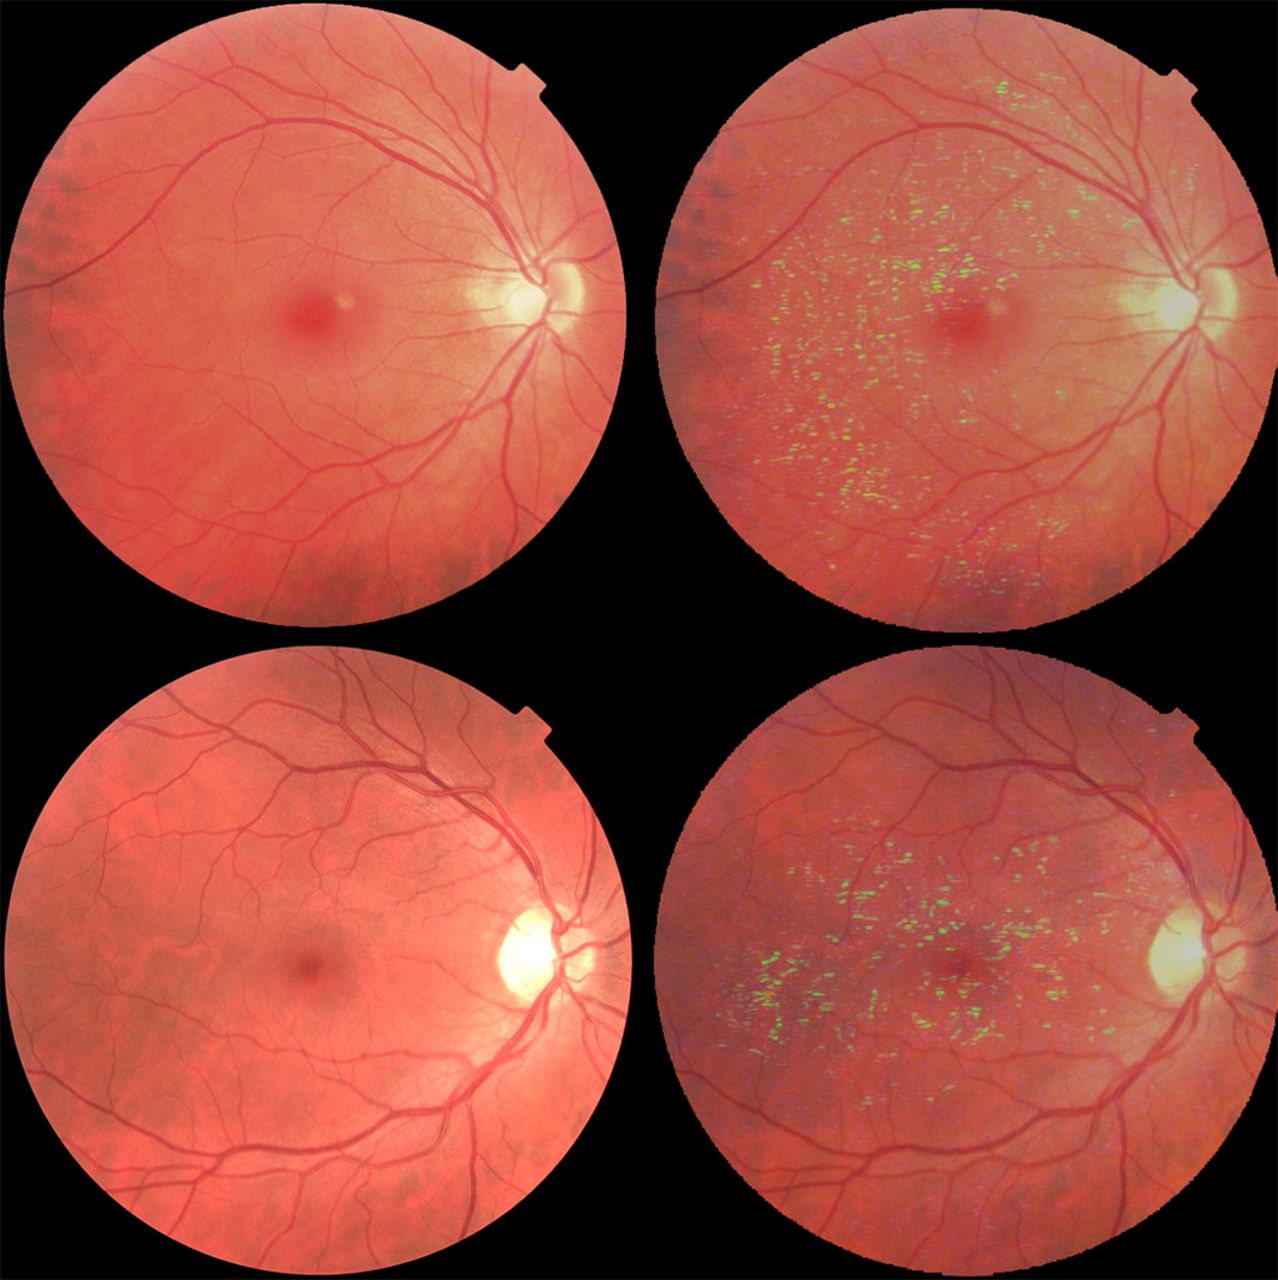
Paired retinal fundus and optical coherence tomography imaging (Topcon 3D OCT 1000 Mk2, Topcon Corp, Tokyo, Japan) data were collected. A 45 degree non-mydriatic and non-stereo fundus image centred on the macular and including the optic disc was taken for each eye. A total of 131 238 images from 66 500 participants were obtained at the baseline examination from the UK Biobank study, among which 80 169 images from 46 969 participants passed the image quality check. The image quality check process has been described in details elsewhere.18 In brief, image quality control was based on ground truth manually labelled by two ophthalmologists, who used a three-level quality grading system (good, usable and reject) and identified low-quality indicators (eg, blurring, uneven illumination, low contrast and artefacts). Fundus images with good and usable quality were considered as those with reasonably good image quality.
Deep learning model for age prediction
Consistent with previous studies,6 8 19–21 chronological age was considered to be equal to biological age in normally ageing individuals. Therefore, in order to set the ground truth of biological age to build and validate the DL model for biological age prediction, participants from the UK Biobank study who did not report any medical history of diseases at the baseline examination were used as the relatively healthy reference dataset. When the ground truth was applied to the test dataset, the difference between predicted biological age and chronological age represented the pathological changes that deviated from normal ageing.
Of the 46 969 participants with reasonable quality fundus images, 11 052 participants did not report any previous diseases as listed in online supplemental table 1. A total of 19 200 fundus images from these relatively healthy individuals were included in the DL model development and validation of the model accuracy using the five-fold cross-validation8 (relatively healthy dataset). A total of 35 913 of the remaining 35 917 participants had available mortality data and were used to investigate the association between retinal age gap and mortality (analysis dataset). Images from the right eyes were used to calculate the retinal age and were replaced by images from the left eyes if not available.
Supplemental material
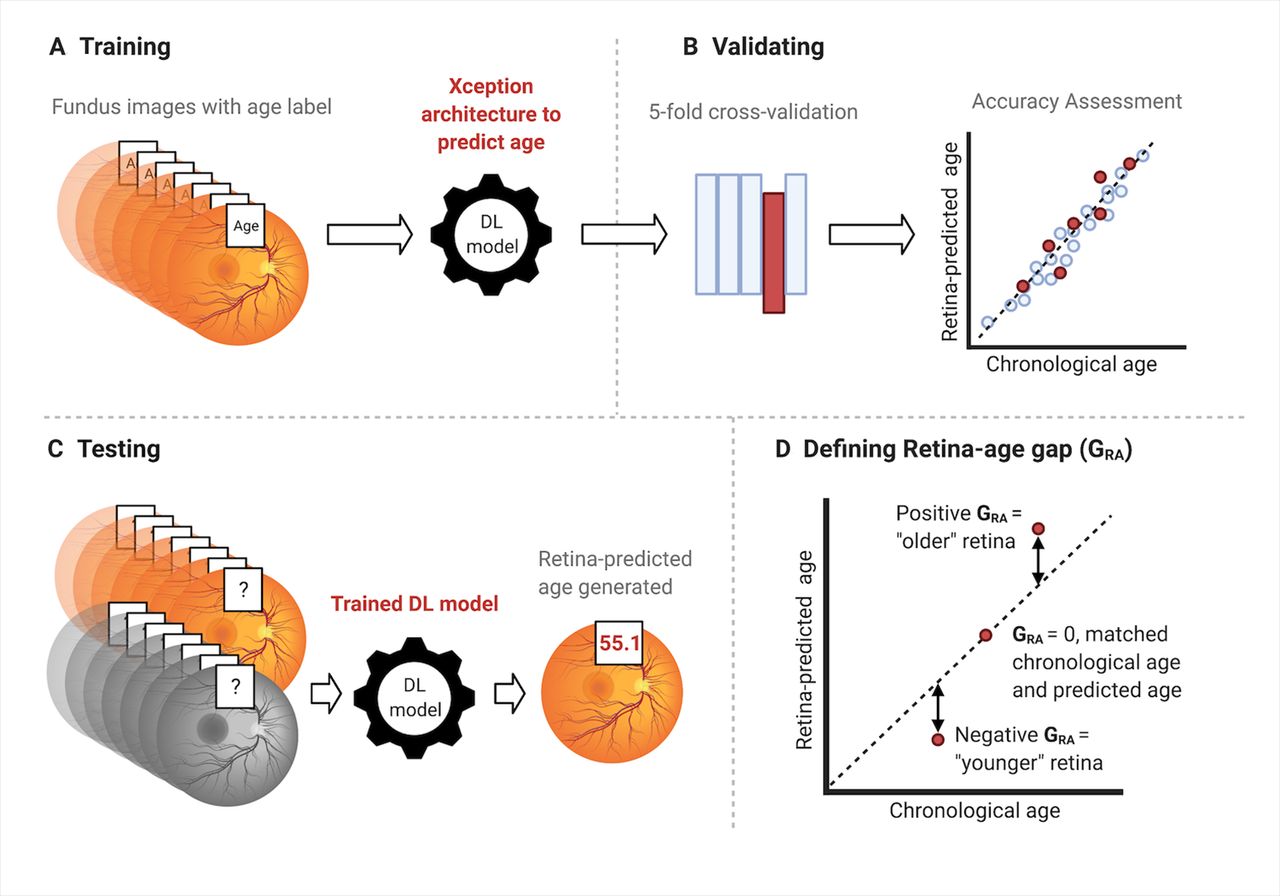
The development and validation of the DL model for age prediction are outlined in figure 1. Briefly, all fundus images were preprocessed by subtracting average colour,22 resized to a resolution of 299*299 pixels, and pixel values rescaled to 0~1 after dividing by 255. After preprocessing, images were fed into a DL model using Xception architecture. During training, data augmentation was performed using random horizontal or vertical flips and the algorithm was optimised using stochastic gradient descent. To prevent overfitting, we implemented a dropout layer with the activation drop rate of 0.5, and carried out early stopping when validation performance did not improve after 10 epochs. The selection of candidate DL models was based on performance in the validation set. The performance of the DL model, including mean absolute error (MAE) and correlation between predicted retinal age and chronological age, was calculated. We then retrieved attention maps from the DL models using guided Grad-CAM,23 which highlights pixels in the input image based on their contributions to the final evaluation.

Overview of the study workflow. Figures showing the study workflow used to calculate retinal age gaps from fundus images. Fundus images were preprocessed and fed into the deep learning (DL) model. (A) The Xception architecture was used to train fundus images from the relatively healthy participants, with chronological age as the outcome variable; (B) the selection of DL models was based on fivefold cross-validation; (C) the DL model was then applied to make retinal age predictions from fundus images for participants in the analysis dataset; (D) the difference between predicted retinal age and chronological age was defined as the retinal age gap. A positive retinal age gap indicated an ‘older’ appearing retina, while a negative retinal age gap indicated a ‘younger’ appearing retina. This figure was created with BioRender.com.
Retinal age gap definition
The difference between retinal age predicted by the DL model and chronological age was defined as the retinal age gap. A positive retinal age gap indicated an ‘older’ appearing retina, while a negative retinal age gap indicated a ‘younger’ appearing retina.
Mortality ascertainment
Mortality status and date of death were ascertained via data linkage to the National Health Service (NHS) Digital for participants in England and Wales, and the NHS Central Register (NHSCR), for participants in Scotland. Specific cause of death was determined by the International Statistical Classification of Diseases and Related Health Problems, 10th revision (ICD-10). Cardiovascular disease (CVD)-related mortality was determined by codes I00 to I09, I11, I13, and I20 to I51 (diseases of heart) and I60 to I69 (cerebrovascular diseases). Cancer-related mortality was determined by codes C00 to C97. Those deaths not attributable to CVD or cancer were considered deaths due to non-CVD/non-cancer mortality. Participants not matched with death certificates were considered alive. Duration of follow-up for each participant (person-year) was calculated as the length of time between baseline age and date of death, loss to follow-up or complete follow-up (28 April 2021), whichever came first.
Covariates
Factors previously known to be associated with mortality24 were included as potential confounders in the present analyses. These variables included baseline age, sex, ethnicity (recorded as white and non-white), Townsend deprivation indices (an area-based proxy measure for socioeconomic status), education attainment (recorded as college or university degree, and others), smoking status (recorded as current/previous and never), physical activity level (recorded as reaching the moderate/vigorous/walking recommendation and not), general health status (recorded as excellent/good and fair/poor), and comorbidities (obesity, diabetes mellitus, hypertension, history of heart diseases and history of stroke).
Body mass index (BMI) was calculated as body weight in kilograms divided by height squared. Obesity was defined as BMI ≥30 kg/m2. Diabetes mellitus was defined as self-reported medical history of diabetes mellitus, the use of antihyperglycaemic drugs or insulin, or a glycosylated haemoglobin level of ≥6·5%. Hypertension was defined as self-reported history of hypertension, the use of antihypertensive drugs, an average systolic blood pressure of at least 130 mm Hg or an average diastolic blood pressure of at least 80 mm Hg. Self-reported history of angina and heart attack was used to classify history of heart diseases.
Statistical analyses
Descriptive statistics, including means and standard deviations (SDs), numbers and percentages, were used to report baseline characteristics of study participants. Uupaired t-tests or analysis of variance was used to compare means on continuous variables, and Pearson’s χ2 tests to compare distributions on categorical variables. Cox proportional hazards regression models considering retinal age gap as a continuous linear term were fitted to estimate the effect of a 1 year increase in retinal age gap on mortality risk. We then investigated associations between retinal age gaps at different quantiles with mortality. In addition, a restricted cubic spline analysis of possible non-linear associations between retinal age gap and mortality status was performed, with five knots placed at equal centiles of the retinal age gap, and retinal age gap of zero used as the reference value. We adjusted Cox models for the following covariates: baseline age, sex, ethnicity, and Townsend deprivation indices (model 1); additional educational level, smoking status, physical activity level, general health status, obesity, diabetes mellitus, hypertension, history of heart diseases, and history of stroke (model 2).
For the investigation on the association between retinal age gap and mortality, fundus images from right eyes were selected for primary analyses, while fundus images from left eyes were selected for sensitivity analyses. Subgroup analyses stratified by age group (age <55 years old versus ≥55 years old), smoking status (current/previous smoker vs non-smoker), diabetes mellitus and hypertension were performed.
The proportional hazards assumptions for each variable included in the Cox proportional hazards regression models were graphically assessed. All variables were found to meet the assumption. The multicollinearity for confounding factors included in multivariable Cox models was tested using the variance inflation factor method, and variance inflation factors for all confounders were <2 (mean 1.16). A two-sided p value of <0·05 indicated statistical significance. Analyses were performed using R (version 3.3.0, R Foundation for Statistical Computing, www.R-project.org, Vienna, Austria) and Stata (version 13, StataCorp, Texas, USA).
Standard protocol approvals, registrations, and patient consent
The National Information Governance Board for Health and Social Care and the NHS North West Multicenter Research Ethics Committee approved the UK Biobank study in accordance with the principles of the Declaration of Helsinki, with all participants providing informed consent. Because of the only access to the deidentified data from a public database, the Medical Research Ethics Committee of Guangdong Provincial People’s Hospital waived the requirements to obtain ethical approval.
Data availability statement
The UK Biobank is an open-access resource to researchers through registration of proposed research. Our study was approved and registered as study 62 525 with the UK Biobank resource.
Code availability statement
The code of this study is available from the corresponding author on request. All models were built using publicly available software and packages.
Role of the funding source
The funders had no role in study design, data collection, data analyses, data interpretation, preparation of the manuscript, and decision to publish. The corresponding author had full access to all data and final responsibility for the decision to submit for publication.
Results
Deep learning model performance for age prediction
The DL model was trained and validated on 11 052 relatively healthy participants with a mean age of 52.6±7.97 years; and with 53.7% female. Online supplemental table 2 shows the baseline characteristics of the participants used for DL models development and validation. Figure 2 shows the performance of the DL model in the relatively healthy dataset. Regression dilution was observed, with the overprediction of age at lower chronological age group and underprediction at higher chronological age group. The trained DL model was able to achieve a strong correlation of 0.81 (p<0·001) between predicted retinal age and chronological age, with an overall MAE of 3.55 years. The Bland and Altman plot of difference in years between chronological age and retinal age is shown in online supplemental figure 1. Two representative examples of fundus images with corresponding attention maps for age prediction are shown in figure 3. Regions around retinal vessels are highlighted by the DL model for age prediction.

Performance of the deep learning model. Scatterplot depicting correlation of predicted age with chronological age in relatively healthy participants.
Attention maps for age prediction. Figures showing representative examples of fundus images with corresponding attention maps for age prediction. Regions highlighted with a brighter colour indicate areas that are used by the deep learning model for age prediction. Regions around the retinal vessels are highlighted.
Retinal age gap
The baseline characteristics of 35 913 participants included in the investigation of the association between retinal age gap and mortality are described in table 1. The distribution of the retinal age gap in the analysis dataset followed a nearly normal distribution (online supplemental figure 2). The mean (SD) and median (IQR) of the retinal age gap were −1.31 (4.82) and −1.18 (−4.18, 1.79). The proportions of fast agers with retinal age gaps more than 3, 5 and 10 years were 51.0%, 27.6% and 4.34%, respectively.
Baseline characteristics of study participants in the test dataset
Baseline characteristics of participants stratified by quantiles of the retinal age gap are shown in online supplemental table 3. There were significant differences in baseline age, gender, ethnicity, Townsend index, educational level, smoking status, physical activity level, health status, obesity, history of hypertension, heart diseases and stroke across the four quantiles of retinal age gap.
Retinal age gap and all-cause mortality
After a median follow-up of 11.0 years (IQR 10.9–11.1 years), a total of 1871 (5.21%) participants died from all causes. The survival curve of participants with retinal age gaps in each quantile is shown in figure 4. Considering linear effects only and following adjustment for all confounding factors, each 1 year increase in retinal age gap was associated with a 2% increase in mortality risk (HR=1.02, 95% CI 1.00 to 1.03, p=0.020; table 2). Compared with participants with retinal age gaps in the lowest quantile, mortality risk was comparable for those in the second quantile (HR=1.05, 95% CI 0.92 to 1.20, p=0.473). Mortality risk was significantly increased for participants with retinal age gaps in the third and fourth quantiles (HR=1.21, 95% CI 1.04 to 1.41, p=0.014; HR=1.35, 95% CI 1.11 to 1.65, p=0.003; respectively; table 2).
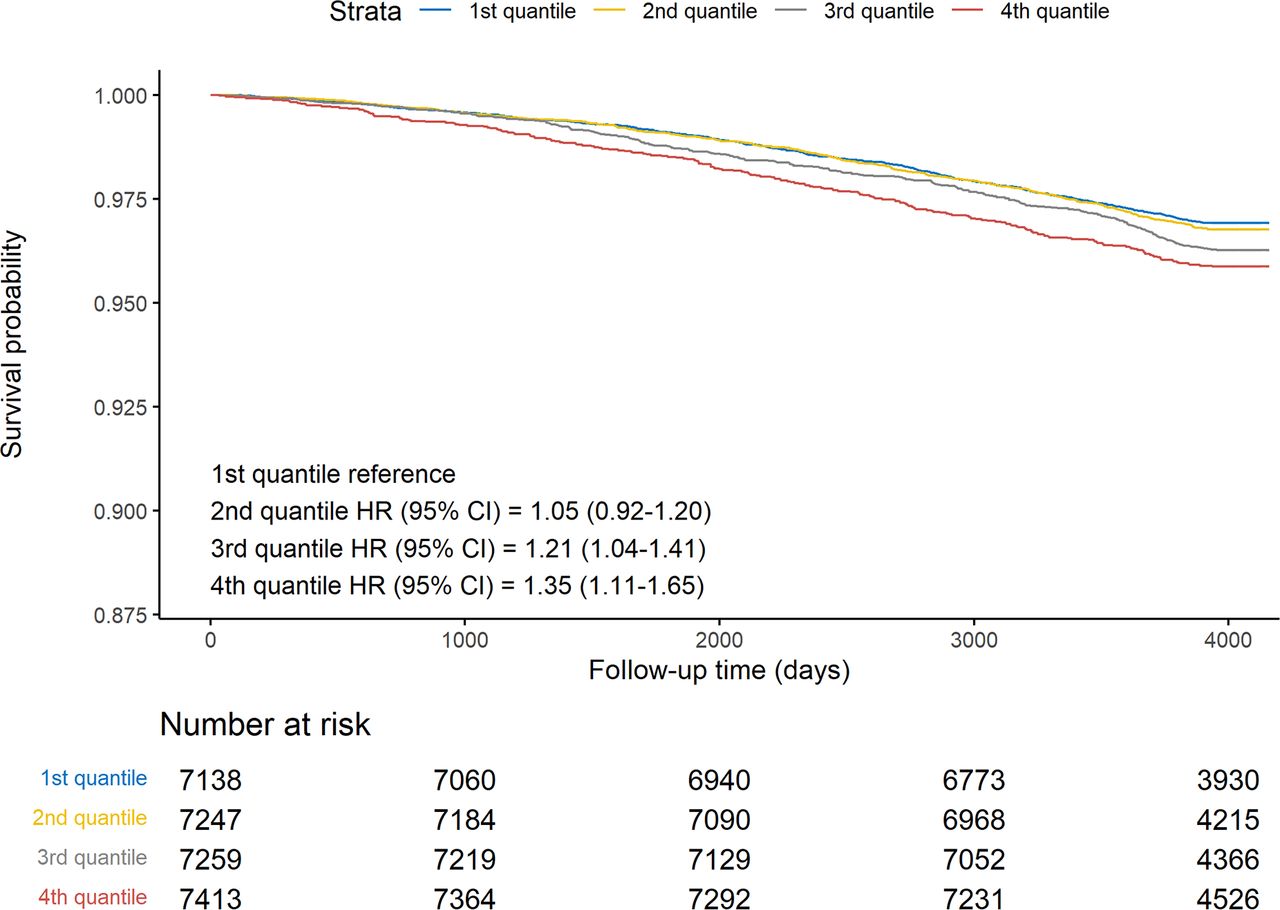
Adjusted survival curves for mortality risk by retinal age gap quantiles. Mortality risk is shown over time for participants in different retinal age gap quantiles. Lower quantiles corresponded to participants who had chronological ages greater than predicted retinal age, whereas higher quantiles corresponded to those with chronological ages lower than predicted retinal age. Plots were based on Cox proportional hazards regression models, adjusted for age, sex, ethnicity, Townsend deprivation indices, educational level, smoking status, physical activity level, general health status, obesity, diabetes mellitus, hypertension, history of heart diseases and history of stroke. Compared with participants with retinal age gaps in the lowest quantile, mortality risk was comparable for those in the second quantile (HR=1.05, 95% CI 0.92 to 1.20, p=0.473). Mortality risk was significantly increased for participants with retinal age gaps in the third and fourth quantiles (HR=1.21, 95% CI 1.04 to 1.41, p=0.014; HR=1.35, 95% CI 1.11 to 1.65, p=0.003, respectively).
Association between retinal age gap with mortality using Cox proportional hazards regression models.
Allowing for non-linearity, figure 5 illustrates the estimated association between retinal age gap and mortality risk. Evidence of an overall and non-linear association between retinal age gap and mortality risk was observed (Poverall <0.001; Pnon-linear=0.002). The association between retinal age gaps and mortality is depicted as a J-shaped curve, where positive retinal age gaps were associated with substantially increased risks of mortality.

Association between retina age gap and mortality risk, allowing for non-linear effects. The reference retinal age gap for this plot (with hazard ratio (HR) fixed as 1·0) was 0 years. The model was fitted with a restricted cubic spline for retinal age gap (knots placed at equal centiles of retina age gap), adjusted for age, sex, ethnicity, Townsend deprivation indices, educational level, smoking status, physical activity level, general health status, obesity, diabetes mellitus, hypertension, history of heart diseases and history of stroke. Evidence of an overall and non-linear association between retinal age gap and mortality risk was observed (Poverall <0.001; Pnon-linear=0.002). The association between retinal age gaps and mortality is depicted as a J-shaped curve, where positive retinal age gaps were associated with substantially increased risks of mortality.
Retinal age gap and cause-specific mortality
Among the 1871 participants who died of all causes, 321 (17.2%), 1018 (54.4%) and 532 (28.4%) deaths were attributable to CVD, cancer and others. Cox proportional hazards regression models showed that participants with retinal age gaps in the third and fourth quantiles were significantly associated with 49% to 67% higher risks of mortality not due to CVD or cancer after multiple adjustments (HR=1.49, 95% CI 1.13 to 1.96, p=0.005; HR=1.67, 95% CI 1.17 to 2.39, p=0.005; respectively; table 3). However, we identified no association of retinal age gap with deaths due to CVD or cancer after multivariate adjustments.
Association between retinal age gap with specific-cause mortality using Cox proportional hazards regression models
Sensitivity analyses
In order to verify the robustness of our findings, fundus images from the left eyes were chosen for the statistical analyses. Similar results were observed for left eyes (online supplemental tables 4 and 5). Another sensitivity analysis was performed to examine the association between retinal age gap with mortality in the full cohort. Similar results were observed, as shown in online supplemental table 6.
Subgroup analyses
Results from subgroup analyses stratified by age group, smoking status, diabetes mellitus and hypertension are presented in online supplemental tables 7–10. Significant associations between retinal age gap and mortality were noted both in younger and older groups, as well as in participants with and without hypertension. In the analyses stratified by smoking status, retinal age gap was closely related to mortality among the current or previous smoker. Analyses stratified by diabetes mellitus showed a significant association between retinal age gap and mortality in non-diabetic participants, but not in diabetic participants.
Discussion
Using a large population-based sample of middle-aged and elderly adults, we developed a DL model that could predict age from fundus images with high accuracy. Further, we found that the retinal age gap, defined as the difference between predicted retinal age and chronological age, independently predicted the risk of mortality, especially of the non-CVD/non-cancer mortality. Our findings have demonstrated that retinal age gap might be a potential biomarker of ageing that can predict mortality risk.
To the best of our knowledge, this is the first study that has proposed retinal age gap as a biomarker of ageing. Our trained DL model achieved excellent performance with a MAE of 3.5, outperforming most existing biomarkers in the prediction of age. Previous studies have shown MAEs of 3.3–5.2 years for DNA methylation clock,25 26 5.5–5.9 years MAEs for blood profiles27 28 and 6.2–7.8 years MAEs for the transcriptome ageing clock.29 30 Neuroimaging and 3D facial imaging have achieved accurate performances in age prediction with MAEs between 4.3 and 7.3,8 31 and 2.8 and 6.4 years,7 20 respectively. Despite these reasonable accuracies, the invasiveness of cellular and molecular ageing biomarkers, high cost and time-consuming nature of neuroimaging and 3D facial ages, and ethical and privacy concerns of facial age, have limited their usefulness. In addition to excellent performance in age prediction, determining retinal age using fundus images is fast, safe, cost-effective and user-friendly, thus offering great potential for use in a large number of people.
Beyond age prediction, our study has extended the application of retinal age to the prediction of survival. Our novel findings have determined that the retinal age gap is an independent predictor of increased mortality risk, especially of non-CVD/non-cancer mortality. These findings suggest that retinal age may be a clinically significant biomarker of ageing. The relevance of the retinal age gap for general health is intuitive, given that the retina is the only organ that is amenable to in vivo visualisation of the microvasculature and neural tissue. The retina offers a unique, accessible ‘window’ to evaluate underlying pathological processes of systemic vascular and neurological diseases that are associated with increased risks of mortality. This hypothesis is supported by previous studies, which have suggested that retinal imaging contains information about cardiovascular risk factors,32 chronic kidney diseases33 and systemic biomarkers.34 In addition, this hypothesis is also consistent with previously reported qualitative and quantitative studies that have found that ocular imaging measures (eg, retinal-vessel calibre) and retinal diseases (eg, glaucoma) are significantly associated with mortality.35 36 The significant association between retinal age gap and non-CVD/non-cancer mortality, together with the growing evidence of the link between eye and brain,37 may support the notion that the retina is the ‘window’ of neurological diseases. Nevertheless, the small sample size of deaths due to dementia (n=20) in the present study was underpowered to investigate the association between retinal age gap and dementia-related mortality. Of note, the non-significant association between retinal age gap and CVD-related mortality may be due to the relatively small sample size of the CVD-related deaths and improvement in treatments of fatal CVD.38 Our pilot study indicated that retinal age gap was an independent predictor for subsequent risk of CVD (defined as the cases from hospital admission dataset and mortality dataset). This body of work supports the hypothesis that the retina plays an important role in the ageing process and is sensitive to the cumulative damages of ageing which increase the mortality risk.
Our findings have several important clinical implications. First, the fast, non-invasive, and cost-effective nature of fundus imaging enables it to be an accessible screening tool to identify individuals at an increased risk of mortality. This risk stratification will assist tailored healthcare decision-making, as well as targeting and monitoring of interventions. Given the rising burden of non-communicable diseases and population ageing globally, the early identification and delivery of personalised healthcare might have tremendous public health benefits. Further, the recent development of smartphone-based retinal cameras, together with the integration of DL algorithms, may in the future provide point-of-care assessments of ageing and improve accessibility to tailored risk assessments. Second, the ability to use fundus images in predicting ageing may improve potential health benefits of eye disease screening, beyond the diagnosis of sight-threatening eye diseases. This may improve the health economic cost-effectiveness of programmes such as diabetic retinopathy screening, thus increasing the impact and access to eye disease screening programmes.
The large-scale sample size, long-term follow-up, standardised protocol in capturing fundus images, validity of mortality data, and adjustment for a wide range of confounding factors in the statistical models of this study support the robustness of our findings. Despite these promising results, our study has several limitations. First, these analyses are limited by retinal images that were captured at a particular cross-section in time, with trajectories in retinal ageing potentially being a better indicator of mortality. Second, participants involved in the UK Biobank study were volunteers, who might not be representative of the population from which they were drawn.39 Of note, the potential healthy effect might underestimate the retinal age gap in the general population, as individuals with extremely poor health were less likely to participate in this study. Nevertheless, the association between retinal age gap and mortality would not be affected due to the representativeness of the sample.39 Third, the lack of external datasets might limit the generalisability of our DL algorithms and findings. Lastly, we were unable to fully exclude the possibility of residual confounders between retinal age gap and mortality.
Conclusion
In summary, we have developed a DL algorithm that can detect footprints of ageing in fundus images and predict age with high accuracy. Further, we have been the first to demonstrate that the retinal age gap is significantly associated with an increased risk of mortality. Our findings suggest that the retinal age gap provides novel insights into healthy ageing. Our work calls for future research into applications of the retinal age gap, and whether retinal age can be used to better understand processes underpinning ageing.
Data availability statement
Data are available in a public, open access repository.
Ethics statements
Patient consent for publication
References
Supplementary materials
Supplementary Data
This web only file has been produced by the BMJ Publishing Group from an electronic file supplied by the author(s) and has not been edited for content.
Supplementary Data
This web only file has been produced by the BMJ Publishing Group from an electronic file supplied by the author(s) and has not been edited for content.
Footnotes
Contributors ZZ and DS conceptualised and designed the study with WW, MH and XY. ZZ and DS did the literature search and wrote the first draft of the manuscript. DS, PG, ZG and WM did the deep learning modelling, ZZ, XS and WW did the statistical analysis. HY, ZG, MH and XY had full access to all of the data. MH was the guarantor. All authors commented on the manuscript.
Funding The present work was supported by Fundamental Research Funds of the State Key Laboratory of Ophthalmology (no grant number), National Natural Science Foundation of China (82000901, 82101173, 81870663, 82171075), Outstanding Young Talent Trainee Program of Guangdong Provincial People’s Hospital (KJ012019087), Guangdong Provincial People’s Hospital Scientific Research Funds for Leading Medical Talents and Distinguished Young Scholars in Guangdong Province (KJ012019457), Talent Introduction Fund of Guangdong Provincial People’s Hospital (Y012018145), Science and Technology Program of Guangzhou, China (202002020049), Project of Special Research on Cardiovascular Diseases (2020XXG007) and Research Foundation of Medical Science and Technology of Guangdong Province (B2021237). MH receives support from the University of Melbourne at Research Accelerator Program (no grant number) and the CERA Foundation (no grant number). The Centre for Eye Research Australia receives Operational Infrastructure Support from the Victorian State Government. The sponsor or funding organisation had no role in the design or conduct of this research.
Competing interests None declared.
Provenance and peer review Not commissioned; externally peer reviewed.
Supplemental material This content has been supplied by the author(s). It has not been vetted by BMJ Publishing Group Limited (BMJ) and may not have been peer-reviewed. Any opinions or recommendations discussed are solely those of the author(s) and are not endorsed by BMJ. BMJ disclaims all liability and responsibility arising from any reliance placed on the content. Where the content includes any translated material, BMJ does not warrant the accuracy and reliability of the translations (including but not limited to local regulations, clinical guidelines, terminology, drug names and drug dosages), and is not responsible for any error and/or omissions arising from translation and adaptation or otherwise.
Linked Articles
- Highlights from this issue