Article Text

Abstract
AIMS To determine indocyanine green (ICG) angiographic features prognostic of visual acuity loss in eyes following a natural course of exudative age related macular degeneration (AMD).
METHODS 89 eyes of 72 patients (48 men, 24 women) aged between 50 and 87 years old (mean 69.5 (SD 8.8) years) with classic and/or occult choroidal neovascularisation (CNV) were reviewed. ICG angiographic features were classified as follows: type 1, well demarcated hyperfluorescence with late ICG leakage; type 2, well demarcated hyperfluorescence with no late dye leakage; type 3, poorly demarcated hyperfluorescence; type 4, no hyperfluorescence. Follow up ranged from 6 to 67 months (mean 19.2 (11.5) months). Logistic regression analyses were performed using change of visual acuity (worse or not) as the dependent variable, and patient age, sex, characteristics of fluorescein angiography (classic or occult CNV), location of CNV, and each ICG type as the independent variables. Odds ratios (ORs) and 95% confidence intervals (CIs) were calculated.
RESULTS Type 1 CNV was associated with the highest risk for visual acuity loss (OR: 7.50, CI: 1.42–39.55, p=0.018) among the present variables. In contrast, CNV having no ICG leakage (type 2, 3, and 4), represented no significantly increased risk.
CONCLUSION Well demarcated hyperfluorescence with late ICG leakage appears to be predictive of visual acuity loss in eyes with CNV. Thus, ICG angiography may offer a useful means of predicting visual outcomes in AMD.
- indocyanine green angiography
- age related macular degeneration
- choroidal neovascularisation
- visual prognosis
- natural history
Statistics from Altmetric.com
- indocyanine green angiography
- age related macular degeneration
- choroidal neovascularisation
- visual prognosis
- natural history
The principal mechanism for severe visual loss in exudative age related macular degeneration (AMD) is choroidal neovascularisation (CNV) and its sequelae—exudation, haemorrhage, fibrovascular proliferation, and disciform scarring. Hayashiet al 1 were the first to report that CNV showed hyperfluorescent leakage in the late phase of indocyanine green (ICG) angiography, and recently, ICG angiography has been demonstrated to be useful in detecting CNV, especially when fluorescein angiography (FAG) cannot reveal well defined CNV. Yannuzziet al 2 and Slakteret al 3 found that 39% and 44%, respectively, of patients with occult CNV by FAG showed well demarcated hyperfluorescence by ICG angiography. However, ICG appearances of CNV vary. For example, Avvad et al 4 observed three different ICG hyperfluorescent patterns in classic CNV by FAG: early well demarcated, late well demarcated, and late poorly demarcated hyperfluorescence. It has been suggested that these various ICG appearances correlate with the different characteristics of specific CNV, and some attempts have been made to demonstrate such correlations between ICG angiographic features and histological characteristics.5-8 Changet al 5 demonstrated that subretinal pigment epithelial CNV showed late, well demarcated hyperfluorescence with little dye leakage on ICG angiography, and suggested that this type of lesion was clinically inactive and did not cause severe visual acuity loss. Chang et al 5 and Trabucchi et al 6 reported that subretinal fibrous scars showed early hypofluorescence and late, poorly delineated areas, or late staining of the proliferative tissue on ICG angiography. Nakajimaet al 7 classified CNV into four types on the basis of ICG angiography (type 1, hyperfluorescence in both the early and late phase; type 2, hyperfluorescence only in the early phase; type 3, hyperfluorescence in the late phase; type 4, virtually no hyperfluorescence in any phase), and examined histological features of surgically removed CNV. Finding that type 1 CNV had many vascular channels and was not covered with the retinal pigment epithelium (RPE) and that type 4 had abundant fibrous tissue, they concluded that ICG appearance correlated with histological characteristics.
If different ICG angiographic features are correlated with different CNV histological characteristics and activities, it seems reasonable to hypothesise that eyes with different ICG angiographic features have different natural courses. If so, is it possible to determine which, if any, ICG angiographic features can identify eyes at high risk for visual loss?
Guyer et al 9 classified the appearance of ICG angiography of CNV into three groups based on the size of the hyperfluorescent lesion—focal spots, plaque, and a combination of both, and investigated the natural course of each type. However, because the number of eyes with each CNV type they studied was relatively small, their findings were inconclusive. We classified our cases in the same way but found no significant difference in visual prognosis among these groups.10 Thus, we concluded that classification based on the size of hyperfluorescence is not helpful in determining visual prognosis. Our clinical experience suggested two types of late hyperfluorescence: hyperfluorescence which, in contrast with surrounding fluorescence levels, increased in the late phase, suggesting late ICG leakage, and hyperfluorescence the brightness of which diminished in the late phase. Also, we noted that eyes with CNV showing hyperfluorescence with marked ICG dye leakage in the late phase often had subretinal bleeding or progressed to the disciform stage, with severe visual acuity loss. In contrast, as shown by Chang et al,5 eyes with CNV showing hyperfluorescence without marked dye leakage on ICG angiography preserved good visual acuity. Therefore, we classified ICG features of CNV on the basis of borders of hyperfluorescence and the presence of dye leakage, and investigated the visual acuity outcomes associated with each type to CNV in an attempt to determine ICG angiographic features that might identify eyes at high risk for visual loss.
Patients and methods
PATIENT RECRUITMENT
We reviewed the records and photographs of 262 eyes of 220 patients (145 men, 75 women) who had been diagnosed with AMD and examined by FAG and ICG angiography in Osaka City University Hospital between November 1991 and March 1997. Among these patients, 37 eyes had no evidence of CNV on FAG, and they were excluded from the present study. Also excluded were 12 eyes that had had previous laser treatment, 98 eyes that had had laser treatment during the follow up period, four eyes that had undergone surgery to remove CNV, six eyes which, upon a review of the records and photographs, showed that the diagnosis should have been idiopathic CNV or high myopia, nine eyes with a follow up of less than 6 months, four eyes with other disorders affecting visual acuity such as glaucoma and diabetic retinopathy, and three eyes in which slit lamp examination showed that cataract had developed during the follow up period.11 The remaining 89 eyes of 72 patients (48 men, 24 women) who satisfied the criteria shown in Table 1 were entered in the present study. The patients’ ages ranged from 50 to 87 years old (average 69.5 (SD 8.8) years). Forty seven eyes were right and 42 left. Follow up ranged from 6 to 67 months (mean 19.2 (11.5) months). The patients underwent best corrected visual acuity measurement by a lantern type visual acuity test chart (with results recorded in decimal notation), indirect ophthalmoscopic observation, and biomicroscopy using a Goldmann contact lens. FAG and ICG angiographies were taken using a fundus camera (Topcon IMAGEnet H-1024 Digital Imaging System, Topcon, Tokyo). For ICG angiography, 25 or 50 mg of ICG was dissolved in 2 ml of aqueous solution and injected intravenously. ICG angiography was performed in accordance with the standards of the ethics committee of Osaka City University Medical School and signed informed consent was obtained. We included patients demonstrating classic CNV or occult CNV by FAG.11 For purposes of further statistical analysis, eyes with a combination of classic and occult CNV were classified as having occult CNV. The location of CNV was designated as subfoveal, juxtafoveal, and extrafoveal based on the Macular Photocoagulation Study Group (MPS) definition.12
Principal eligibility criteria
CLASSIFICATION OF ICG ANGIOGRAM
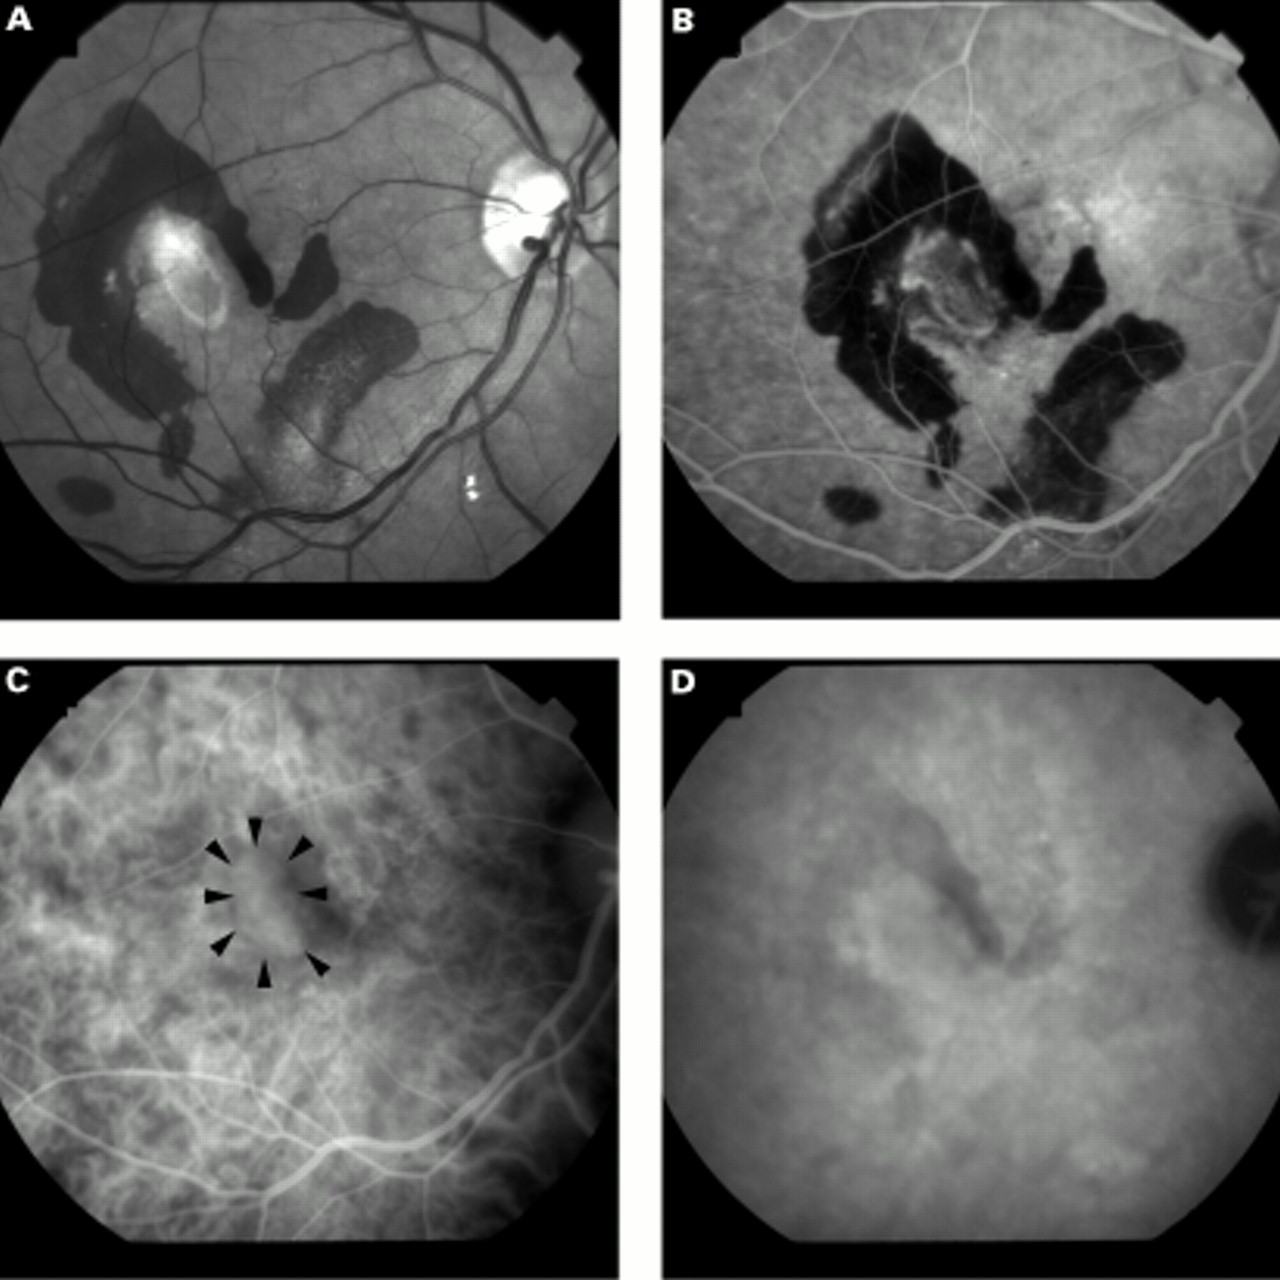
We observed ICG angiographic features of the exact lesions in which classic or occult CNV had been confirmed on FAG. The ICG features were judged at three different phases; within 3 minutes after ICG injection (early phase), 5–10 minutes after injection (middle phase), and more than 20 minutes after injection (late phase). The ICG features of the presumed CNV were classified into four groups:type 1: well demarcated hyperfluorescence with ICG dye leakage occurring in the late phase from the whole lesion or a part of the lesion. There were two patterns of hyperfluorescence: one was well demarcated hyperfluorescence and/or cartwheel of capillary vessels in the early phase and lasting throughout the late phase with late ICG leakage (Fig 1), and the other was hyperfluorescence obscured in the early phase but becoming well demarcated in the middle to late phase with late ICG leakage (Fig 2);type 2: well demarcated hyperfluorescence in the early and middle phase with little ICG leakage in the late phase (Figs 3, 4); type 3: poorly demarcated hyperfluorescence in any phase (Fig 5);type 4: no hyperfluorescence in any phase (Fig 6).
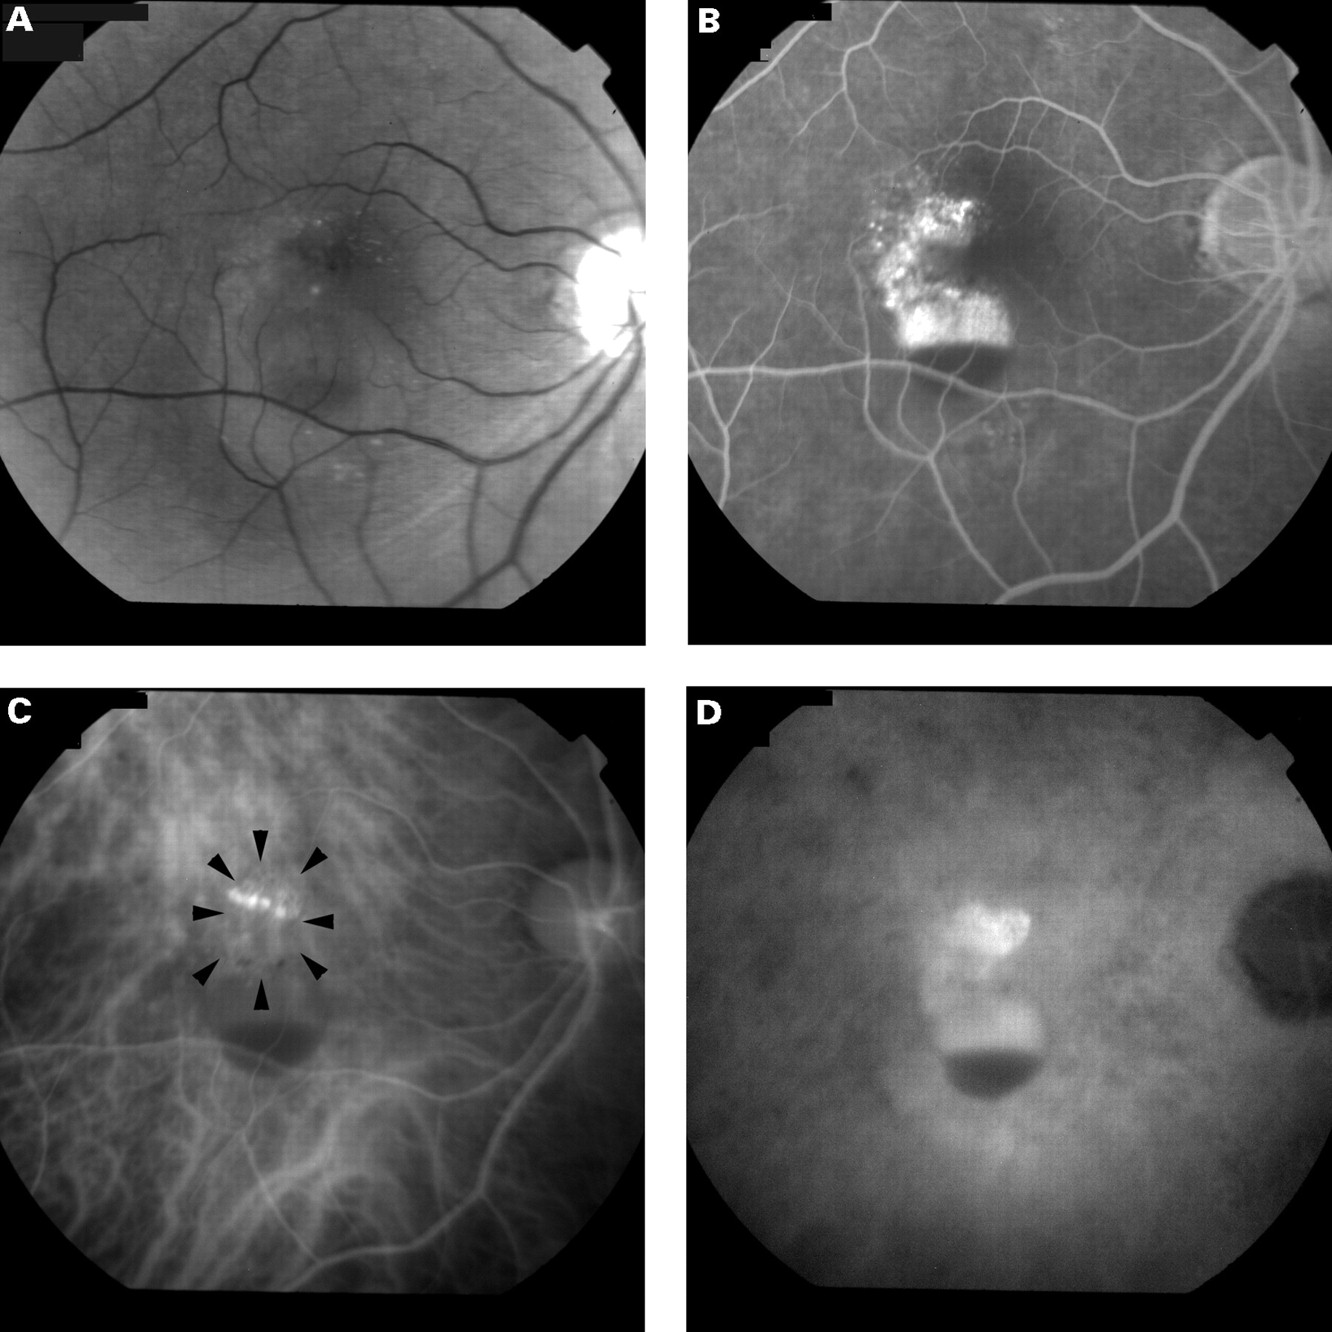

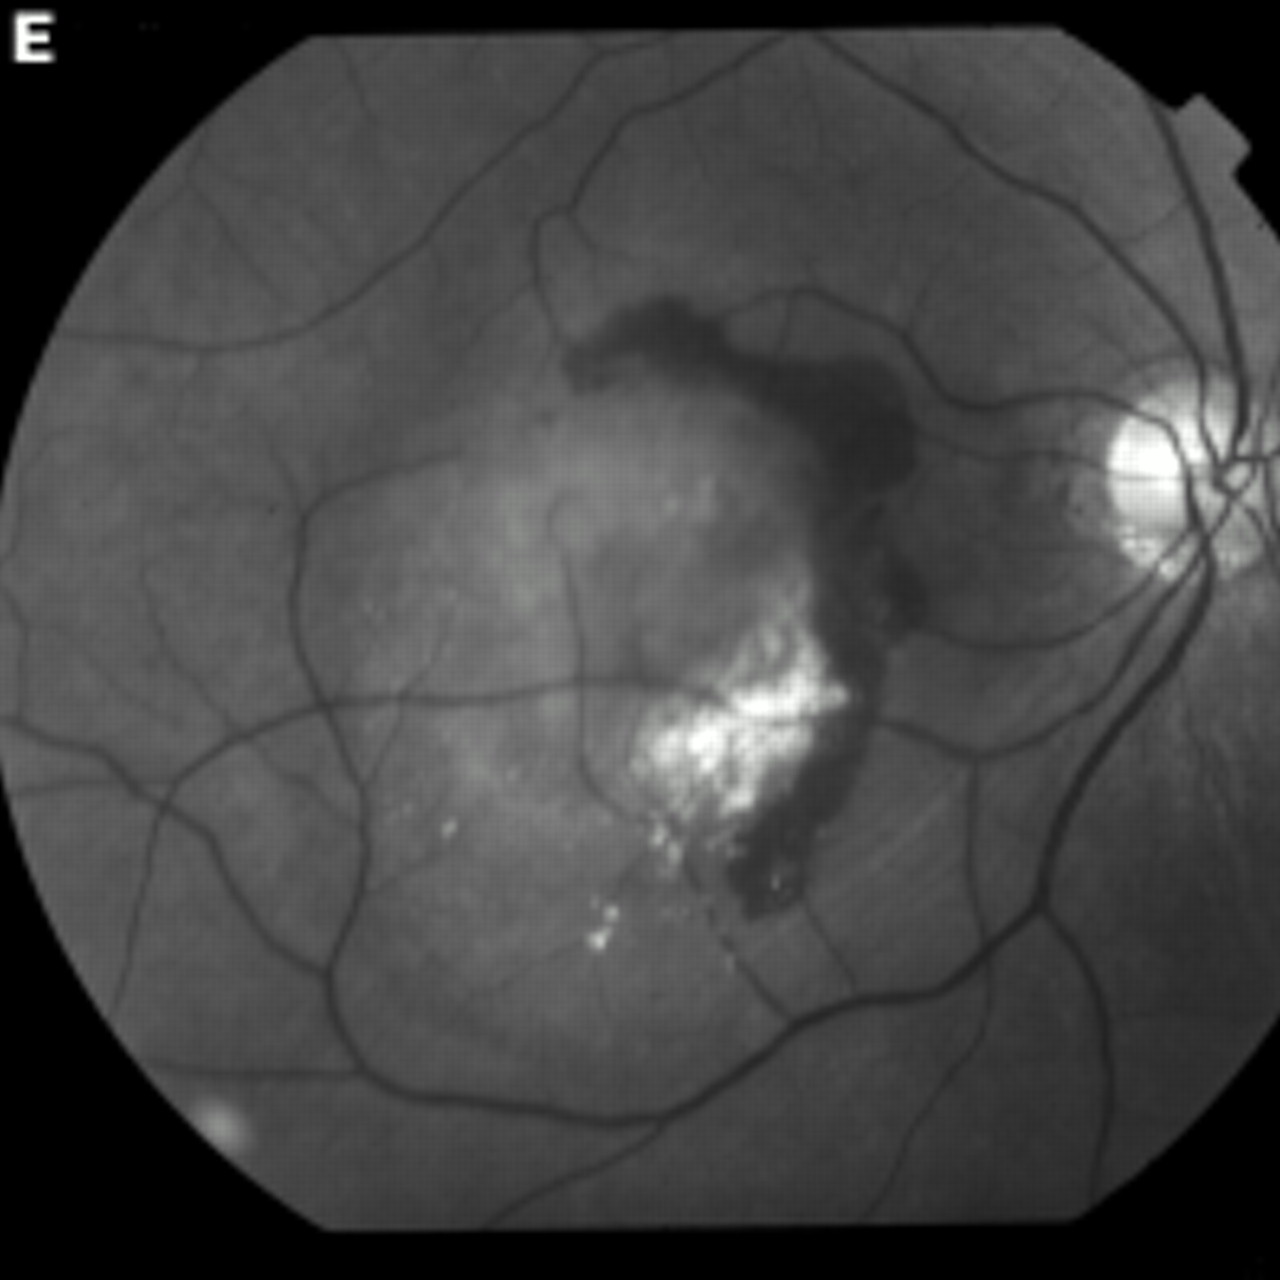
Right eye of a 67 year old man. (A) Fundus photograph shows haemorrhagic pigment epithelial detachment with serous sensory retinal detachment. Visual acuity was 20/30. (B) Fluorescein angiography 5 minutes after dye injection shows hyperfluorescence of occult choroidal neovascularisation and pooling of the dye in the subretinal pigment epithelial space. (C) Early phase indocyanine green angiography shows well demarcated hyperfluorescence of choroidal neovascularisation (surrounded by arrowheads). (D) Late phase indocyanine green angiography. The contrast between the fluorescence of the neovascular tissue and that of the surrounding area is high, and hyperfluorescence is slightly greater, with a blurred margin, in the late phase than that in the early phase. Dye pooling in the subretinal pigment epithelial space is noted. (E) Fundus photograph taken 19 months later shows a disciform lesion with subretinal haemorrhage and exudate. His visual acuity had declined to 20/2000.
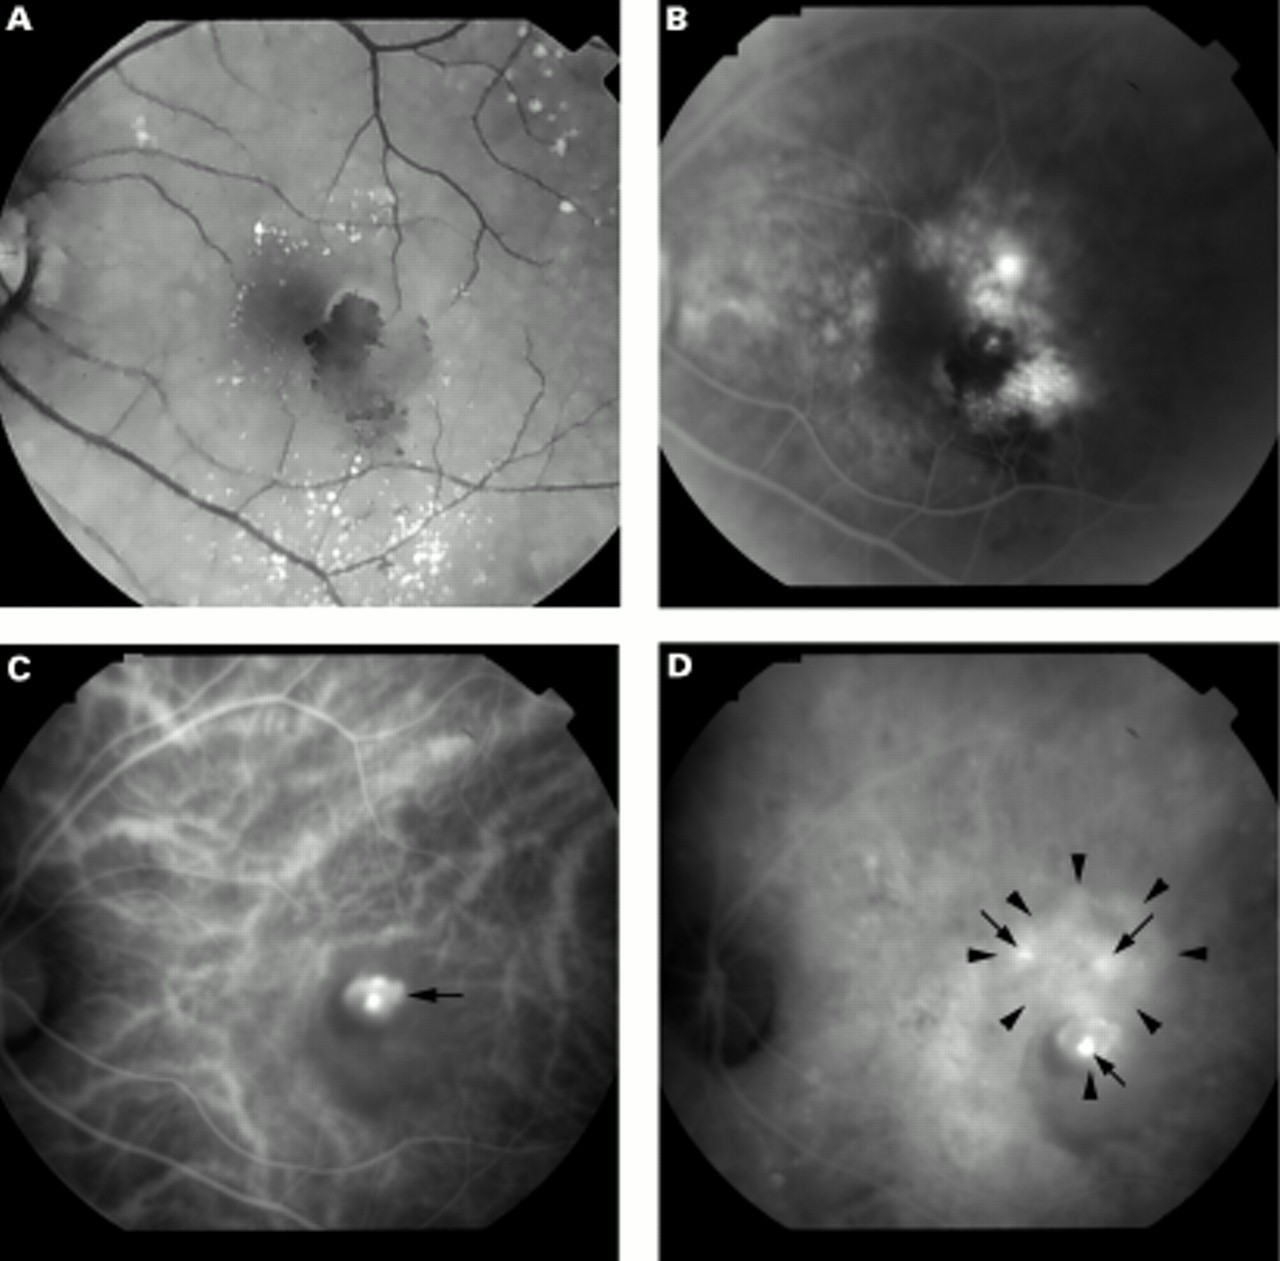

Left eye of a 70 year old woman. (A) Fundus photograph shows elevation of retinal pigment epithelium with subretinal haemorrhage and sensory retinal detachment. Visual acuity was 20/30. (B) Fluorescein angiography 7 minutes after dye injection shows fluorescein leakage from the choroidal neovascularisation. Blood blocks a part of hyperfluorescence from the neovascularisation. (C) Early phase indocyanine green angiography shows hyperfluorescence (arrow). (D) Late phase indocyanine green angiography shows hyperfluorescent plaque of choroidal neovascularisation (surrounded by arrowheads). Dye leakage overlying the plaque is noted at three portions (arrows). Upper part of the plaque is obscure in early phase. (E) Fundus photograph taken 10 months later shows progression of the subretinal fibrous tissue corresponding to the hyperfluorescent area in (D). Her visual acuity had declined to 20/70.

Right eye of a 58 year old man. Visual acuity was 20/400. (A) Fundus photograph shows subretinal fibrovascular tissue with surrounding subretinal haemorrhage. (B) Fluorescein angiography 34 seconds after dye injection shows hyperfluorescence from the choroidal neovascularisation. (C) Early phase indocyanine green angiography shows well demarcated hyperfluorescence (surrounded by arrowheads). (D) Late phase indocyanine green angiography. The lesion shows little ICG leakage. Follow up of 34 months revealed that exudative change such as subretinal haemorrhage and sensory retinal detachment had resolved, leaving a subretinal fibrous scar; visual acuity was preserved.

Left eye of a 71 year old man. (A) Fundus photograph shows elevation of retinal pigment epithelium with a little sensory retinal detachment and hyperpigmentation or hypopigmentation associated with drusen. Visual acuity was 20/30. (B) Fluorescein angiography 7 minutes after dye injection shows mild dye leakage. (C) Middle phase indocyanine green angiography shows slight hyperfluorescence (surrounded by arrowheads). (D) Late phase indocyanine green angiography shows well demarcated choroidal hyperfluorescence. Since the margin of hyperfluorescence is clear and the size of the hyperfluorescence in the late phase is same to that in the middle phases, we assumed that there was no active dye leakage. The eye had no apparent morphological change during a 31 month follow up period and no loss of vision.

Left eye of a 61 year old woman. Visual acuity was 20/30. (A) Fundus photograph shows mottled pigmentation of retinal pigment epithelium and drusen with sensory retinal detachment. (B) Fluorescein angiography 6 minutes after dye injection shows dye leakage form choroidal neovascularisation. (C) Late phase indocyanine green angiography. Hyperfluorescence is apparent, but the border is not distinct. Sensory retinal detachment was resolved at the 21 months’ follow up examination, at which time her visual acuity had improved to 20/20.

Right eye of a 72 year old man. Visual acuity was 20/200. (A) Fundus photograph shows subretinal fibrous tissue with surrounding subretinal haemorrhage. (B) Fluorescein angiography 1 minutes after dye injection shows hyperfluorescence of the subretinal fibrovascular tissue. (C) Early phase indocyanine green angiography. The fluorescence of the subretinal fibrovascular tissue (arrow) is weaker than that of the surrounding chorioretina. (D) Late phase indocyanine green angiography shows no apparent hyperfluorescent lesion corresponding to the subretinal fibrovascular tissue.
A lesion was designated hyperfluorescent if the hyperfluorescence could be distinguished from that of the surrounding area. A lesion with the same brightness of fluorescence or hypofluorescence compared with the surrounding region was defined as having no hyperfluorescence. Well demarcated hyperfluorescent lesions were defined as those with borders readily distinguishable from the surrounding level of fluorescence, whereas poorly demarcated lesions had borders that were difficult to distinguish in this way. When both types of borders were present in one lesion, the image was classified as having a poorly demarcated hyperfluorescence. ICG dye leakage was said to be present when the following three criteria were met: (1) the contrast of fluorescence between the CNV and the surrounding fluorescence level markedly increased in the late phase, (2) the size of the hyperfluorescent lesion became larger in the late phase than that it had been in the early and middle phases, and (3) the borders of hyperfluorescence became blurred in the late phase. FAG and ICG angiograms were analysed independently by two of the authors (OA and NK). If there was a discrepancy, the reclassification was performed together by both authors.
STATISTICAL ANALYSIS
Decimal visual acuity was converted to the minimal angle of resolution (MAR), and the logarithm of MAR was used to calculate average of visual acuity. The change in visual acuity was categorised as either worse or not. “Worse” visual acuity was defined as a change of two or more folds of MAR. Logistic regression analyses were performed using the sas system (SAS Institute, Cary, NC, USA), with the change of visual acuity (worse or not) as the dependent variable, and patient age, sex, characteristics of FAG (classic type of CNV or occult type), location of CNV (extrafoveal, juxtafoveal, or subfoveal), and ICG angiographic features (presence of type 1, 2, or 3) as the independent variables. Since the absence of type 1, 2, or 3 represented type 4, type 4 was not considered an independent variable. Age was used as a continuous variable, and the other factors as categorical variables. Odds ratios (ORs) and 95% confidence intervals (CIs) were calculated to assess the relative risk of visual acuity loss.
Results
Initial visual acuity in the 89 study eyes ranged from 20/13 to counting fingers; the geometric mean visual acuity was 20/77. Visual acuity at the final follow up examination ranged from 20/17 to hand movements; the geometric mean was 20/125. Thirty one eyes (34.8%) had a visual acuity loss of two or more folds of MAR. Seven eyes (7.9%) improved by one half or less folds of MAR; 51 eyes (57.3%) had no change in visual acuity. Twenty eight eyes (31.4%) had classic CNV by FAG, 58 (65.2%) had occult CNV. Three (3.4%) had a combination of classic and occult CNV. Sixteen eyes (18.0%) had extrafoveal CNV, 23 (25.8%) juxtafoveal, and 50 (56.2%) subfoveal CNV. Thirty four (38.2%) showed type 1 CNV on ICG angiography, 33 (37.1%) type 2, six (6.7%) type 3, and 16 (18.0%) type 4. Visual acuity outcomes and CNV characteristics by sex and age are summarised in Table 2, and ORs with 95% CI and their p values for each variable are shown in Table 3. The risk for visual acuity loss increased with age (OR: 1.20, p=0.0001). OR was 6.19 when each patient was compared with another patient 10 years older. The increased risk for visual acuity loss was also significantly higher in men than in women (OR: 4.30, p=0.035). The location of the CNV did not affect the significant change of visual acuity. Occult CNV on FAG showed a moderate but non-significant increase in the risk of visual acuity loss. Among ICG features of CNV, type 1 showed significantly high increased risk (OR: 7.50, p=0.018).
Visual acuity outcomes and characteristics of choroidal neovascularisation (CNV) by age and sex
Odds ratios for visual acuity loss
Discussion
In the present study, CNV showing well demarcated hyperfluorescence with dye leakage in the late phase (type 1) was associated with the highest risk for visual acuity loss among the dependent variables investigated (OR: 7.50, CI: 1.42–39.55, p=0.018). In contrast, CNV showing well demarcated hyperfluorescence but having no ICG leakage (type 2) represented no significant increased risk (OR: 1.30, CI: 0.24–6.91, p=0.759). Thus, late ICG leakage from CNV was associated with loss of visual acuity during follow up (mean 19.2 (11.5) months).
Approximately 98% of the ICG binds to protein.13 14 Free ICG molecules are presumed to penetrate the normal fenestration and intercellular junctions of the choriocapillaris, while protein bound ICG molecules barely penetrate at all. Therefore, it is speculated that ICG leakage results from a breakdown of the intercellular junction of the endothelial cells of CNV or increased permeability of the fenestration of CNV, although no difference between the permeability of the two types of fenestration—that is, normal fenestration of the choriocapillaris and fenestration of CNV, has been reported. Ishibashiet al’s failure to find intercellular junctional complexes among the endothelial cells of immature active CNV,15 suggests that it is in this type of CNV that ICG leakage occurs. On the other hand, Ryan et al 16 found that fluorescein leakage occurred when the CNV was not covered by the RPE and there was subretinal fluid space around the CNV. This phenomenon has not been investigated in ICG angiography, but the same mechanism is likely. Some space may be necessary to allow leaked ICG molecules to pool around the CNV. We speculate, then, that the CNV that showed ICG leakage (type 1) was an immature, active CNV, or CNV not entirely covered by RPE. This conjecture is consistent with Nakajima et al’s7 report that CNV that showed early and late well demarcated hyperfluorescence were highly vasculative, containing immature new vessels, and was not covered by RPE. Our investigation of the reason for visual acuity loss in eyes with type 1 CNV showed that among 19 eyes with visual acuity loss, seven had visual loss due to enlargement and extension of subretinal fibrous tissue to the fovea, four due to the presence or increase of subretinal haemorrhage, one due to occurrence of vitreous haemorrhage, three due to long standing presence of sensory retinal detachment, and four due to the enlargement and extension of retinal pigment epithelial degeneration to the fovea. Therefore, immature, active type 1 CNV apparently grows or occurs bleeding, reducing visual acuity.
Two patterns of type 2 CNV were apparent in the present study. One had subretinal fibrovascular tissue, which showed a relatively small amount of fluorescein leakage (Fig 3). Jalkh et al 17 have suggested that this type of CNV is inactive. The other pattern was similar to the ICG appearance of the right eye in a case reported by Chang et al.5 Since the absorption and emission wavelength of ICG is in the infrared range, which readily penetrates the RPE, subretinal pigment epithelium CNV are also well delineated by ICG angiography. Thus, CNV are well delineated in the early phase, but as shown by Chang et al,5 there may be little leakage from CNV buried in the basal laminar deposits with no space around the CNV. We speculated that the late hyperfluorescence of this type of CNV (Fig 4) represented staining of some materials such as basal laminar and basal linear deposits just around the CNV.
We did not find any distinct reason why type 3 in the present study did not represent a high risk for visual acuity, but some cases seemed to have a subretinal pigment epithelium CNV similar to that in type 2.
Eyes with type 4 CNV in the present study had subretinal fibrous tissue, which was similar to the ICG appearance reported by Changet al 5 and Trabucchiet al.6 This type of CNV reportedly showed fibrous reaction, and Trabucchiet al demonstrated that the endothelium of the new vessels had a non-leaking morphology, with tight intercellular junctions and no fenestration.
The prognosis of visual acuity in the eyes that had CNV showing no late ICG leakage (type 2, 3, or 4) over a period longer than the present follow up is unknown. Since active CNV may develop from the hyperfluorescent lesions in these eyes, we will continue to follow them carefully.
The MPS18-20 reports noted that visual acuity loss was more frequently in older individuals who had classic CNV. Consistent with these previous studies, we found that increased risk for visual acuity loss was significantly higher in older patients, although our cases included occult CNV. On the other hand, our findings that eyes with occult CNV had a higher risk for visual acuity loss than those with classic CNV conflicts with the finding in other studies21 22 that the natural history of the occult type was more benign than that of the classic type. However, our finding may be unreliable, since the OR of this type of CNV by FAG in the present study was statistically non-significant. Also, the relatively small number of eyes studied may have introduced some bias.
In the present study, visual acuity loss occurred in five of 16 (31%) eyes with extrafoveal CNV, six of 23 (26%) with juxtafoveal CNV, and 20 of 50 (40%) with subfoveal CNV. Subfoveal CNV tended to have a high rate of visual acuity loss, but the difference between the incidence of visual acuity loss in each location was non-significant, and the location of CNV had no significant effect on the relative risk of visual acuity loss among the dependent variables we investigated. These findings are consistent with the MPS18-20 finding that although visual acuity loss occurred more frequently in eyes with subfoveal CNV than in those with extrafoveal CNV, the difference was non-significant.
According to the MPS data,18-20 men with juxtafoveal or subfoveal classic CNV have a higher rate of visual acuity loss than women. Bressler et al 23 also suggest that men with occult CNV have a higher frequency of visual acuity loss than women. Our results are consistent with these findings.
In the present study, late ICG leakage was evaluated by two of the authors (OA and NK), who looked for the criteria delineated in our ICG classification. While suitable for a clinical setting, this method of quantifying the amount of ICG leakage is still necessarily subjective to a degree. We are investigating a new, presumably more objective, method of computer assisted measurement of leaked ICG fluorescence.
The number of patients in the present study was small; however, it appears that there are substantial differences in the visual acuity outcome of patients with CNV, depending on ICG angiographic features. Since, however, many factors, such as smoking, systemic hypertension, dietary nutrition, exposure to light, and genetic predisposition, affect the development of CNV,24 25 and these factors may influence the prognosis once CNV has developed, it is difficult to predict visual acuity outcomes precisely. Still, ICG angiography seems to offer useful information in this respect.
Acknowledgments
The authors acknowledge the statistical assistance of Mitsuru Fukui, PhD, in the Department of Statistics, Osaka City University Medical School.
This study was supported by a grant in aid for scientific research C2 of the Ministry of Education, Science, Sports and Culture, Japan (No 09671812).